HAMI-core 调试
HAMI-core 是一个用于拦截CUDA-Driver的动态链接库, 动态库调试相对比较麻烦,这里记录下调试方式
1. 动态链接库编译
1.1. 编译时需要增加debug符号
编译时需要增加debug符号,在CMakeLists.txt中增加-DCMAKE_BUILD_TYPE=Debug 主要标记为 -g -fvisibility=hidden
set(LIBRARY_COMPILE_FLAGS -shared -fPIC -D_GNU_SOURCE -fvisibility=hidden -Wall)
-g是生成调试信息-fvisibility=hidden是隐藏符号,如果不设置暴露所有方法,在调试时容易碰到glibc版本问题,导致无法调试
/libvgpu/build/test/test_alloc: symbol lookup error: /libvgpu/build/libvgpu.so: undefined symbol: _dl_sym
[Inferior 1 (process 2166963) exited with code 0177]
-Wall是开启所有警告。
1.2. 设置方法可调试
需要注意 -fvisibility=hidden 会隐藏所有符号,包括 __attribute__((visibility("default"))) 标记的符号,所以需要手动添加 __attribute__((visibility("default"))) 标记的符号。在在项目中 src/libvgpu.c 已定义宏
#define FUNC_ATTR_VISIBLE __attribute__((visibility("default")))
所以如果需要调试 libvgpu.so 需要手动添加 FUNC_ATTR_VISIBLE 标记即可,例如
FUNC_ATTR_VISIBLE void* dlsym(void* handle, const char* symbol) {
    pthread_once(&dlsym_init_flag,init_dlsym);
    LOG_DEBUG("into dlsym %s",symbol);
    if (real_dlsym == NULL) {
        real_dlsym = dlvsym(RTLD_NEXT,"dlsym","GLIBC_2.2.5");
但是其他文件中未定义 FUNC_ATTR_VISIBLE 宏,所以需要手动添加, 需要调试的函数都需要添加,否则调试不到
1.3. 编译
项目中提供了两种方式
make build-in-docker在docker中构建make build在本地构建
有docker的情况下推荐本地在docker中构建,但是需要注意设置项目路径为/libvgpu,否则调试会报错
构建完毕之后在/libvgpu/build目录下会生成如下内容(下面仅列举了后面可能会用到的)
build
├── libvgpu.so
└── test
    ├── test_alloc
    ├── test_alloc_hold
    ├── test_alloc_host
    ├── test_alloc_managed
    ├── test_alloc_pitch
    ├── test_create_3d_array
    ├── test_create_array
    ├── test_host_alloc
    ├── test_host_register
    ├── test_runtime_alloc
    ├── test_runtime_alloc_host
    ├── test_runtime_alloc_managed
    ├── test_runtime_host_alloc
    ├── test_runtime_host_register
    └── test_runtime_launch
2. debug确认
编译完成之后首先要确认 libvgpu.so 是否包含调试信息
readelf -S libvgpu.so | grep debug
# 有如下输出说明有debug信息
  [27] .debug_aranges    PROGBITS         0000000000000000  0004ae2f
  [28] .debug_info       PROGBITS         0000000000000000  0004b0cf
  [29] .debug_abbrev     PROGBITS         0000000000000000  0007016f
  [30] .debug_line       PROGBITS         0000000000000000  00072968
  [31] .debug_str        PROGBITS         0000000000000000  0007c556
  [32] .debug_line_str   PROGBITS         0000000000000000  0008abd6
  [33] .debug_rnglists   PROGBITS         0000000000000000  0008b118
例如我们要调试 nvmlDeviceGetMemoryInfo 方法,且在上面设置了 FUNC_ATTR_VISIBLE 宏,则需要确认 libvgpu.so 中是否包含 nvmlDeviceGetMemoryInfo 方法
nm -D libvgpu.so | grep nvmlDeviceGetMemoryInfo
# 有如下输出即可
0000000000017549 T nvmlDeviceGetMemoryInfo
so侧的设置已经完成,还需要设置gdb侧的设置, 例如我们需要以测试用例程序进行gdb则需要检查测试用例是否带了debug标记
readelf -S test/test_alloc | grep debug
# 有如下输出即可
  [28] .debug_aranges    PROGBITS         0000000000000000  0000303b
  [29] .debug_info       PROGBITS         0000000000000000  0000306b
  [30] .debug_abbrev     PROGBITS         0000000000000000  00004ab7
  [31] .debug_line       PROGBITS         0000000000000000  00004db2
  [32] .debug_str        PROGBITS         0000000000000000  00005653
  [33] .debug_line_str   PROGBITS         0000000000000000  0000734c
  [34] .debug_loclists   PROGBITS         0000000000000000  000074a5
  [35] .debug_rnglists   PROGBITS         0000000000000000  000079c6
准备完毕开始设置环境进行调试
3. 动态链接库加载
由于HAMI-core是通过实现 dlsym 来实现动态链接库的加载,所以需要设置环境变量 LD_PRELOAD 指向 libvgpu.so 来实现提前加载,拦截到CUDA-Driver的调用
export LD_PRELOAD=/libvgpu/build/libvgpu.so
验证下
LD_DEBUG=libs ./test/test_alloc
# 输出如下 有calling init: /libvgpu/build/libvgpu.so 说明加载成功
   1758842:	  trying file=/lib/x86_64-linux-gnu/librt.so.1
   1758842:
   1758842:
   1758842:	calling init: /lib64/ld-linux-x86-64.so.2
   1758842:
   1758842:
   1758842:	calling init: /lib/x86_64-linux-gnu/libc.so.6
   1758842:
   1758842:
   1758842:	calling init: /lib/x86_64-linux-gnu/librt.so.1
   1758842:
   1758842:
   1758842:	calling init: /lib/x86_64-linux-gnu/libdl.so.2
   1758842:
   1758842:
   1758842:	calling init: /lib/x86_64-linux-gnu/libm.so.6
   1758842:
   1758842:
   1758842:	calling init: /lib/x86_64-linux-gnu/libpthread.so.0
   1758842:
   1758842:
   1758842:	calling init: /usr/local/cuda-12.4/lib64/libcuda.so.1
   1758842:
   1758842:
   1758842:	calling init: /lib/x86_64-linux-gnu/libnvidia-ml.so.1
   1758842:
   1758842:
   1758842:	calling init: /libvgpu/build/libvgpu.so
   1758842:
   1758842:
   1758842:	initialize program: ./test/test_alloc
   1758842:
   1758842:
   1758842:	transferring control: ./test/test_alloc
4. 调试
gdb ./test/test_alloc
# 打断点, 此处需要看程序内部,例如有main函数,则打断点在main函数
b main
# 运行
r
# 查看so是否被加载
info sharedlibrary
# 有如下输出说明so被加载
# 0x00007ffff7f727f0  0x00007ffff7fa1db0  Yes         /libvgpu/build/libvgpu.so
From                To                  Syms Read   Shared Object Library
0x00007ffff7fc5090  0x00007ffff7fee315  Yes         /lib64/ld-linux-x86-64.so.2
0x00007ffff7f727f0  0x00007ffff7fa1db0  Yes         /libvgpu/build/libvgpu.so
0x00007ffff6c18750  0x00007ffff6d6aae2  Yes (*)     /lib/x86_64-linux-gnu/libnvidia-ml.so.1
0x00007ffff5160d80  0x00007ffff55f75d4  Yes (*)     /usr/local/cuda-12.4/lib64/libcuda.so.1
0x00007ffff4e84700  0x00007ffff501693d  Yes         /lib/x86_64-linux-gnu/libc.so.6
0x00007ffff7f5f040  0x00007ffff7f5f105  Yes         /lib/x86_64-linux-gnu/libpthread.so.0
0x00007ffff7e833a0  0x00007ffff7efe8c8  Yes         /lib/x86_64-linux-gnu/libm.so.6
0x00007ffff7e71040  0x00007ffff7e71105  Yes         /lib/x86_64-linux-gnu/libdl.so.2
0x00007ffff7e6c080  0x00007ffff7e6c275  Yes         /lib/x86_64-linux-gnu/librt.so.1
# 在so的需要调试的函数打断点
b nvmlDeviceGetMemoryInfo
# 确认断点位置正确
list nvmlDeviceGetMemoryInfo
# 输出如下, 符合在代码中的预期
362	    }
363	    return NVML_SUCCESS;
364	}
365
366	 __attribute__((visibility("default")))
367	 nvmlReturn_t nvmlDeviceGetMemoryInfo(nvmlDevice_t device, nvmlMemory_t* memory) {
368	    return _nvmlDeviceGetMemoryInfo(device,memory,1);
369	}
370
371	nvmlReturn_t nvmlDeviceGetMemoryInfo_v2(nvmlDevice_t device, nvmlMemory_v2_t* memory) {
# 或者
(gdb) info functions  nvmlDeviceGetMemoryInfo
# 输出如下 说明断点在 `/libvgpu/src/nvml/hook.c` 文件中, 拦截成功符合预期
All functions matching regular expression "nvmlDeviceGetMemoryInfo":

File /libvgpu/src/nvml/hook.c:
317:	nvmlReturn_t _nvmlDeviceGetMemoryInfo(nvmlDevice_t, nvmlMemory_t *, int);
367:	nvmlReturn_t nvmlDeviceGetMemoryInfo(nvmlDevice_t, nvmlMemory_t *);
371:	nvmlReturn_t nvmlDeviceGetMemoryInfo_v2(nvmlDevice_t, nvmlMemory_v2_t *);

Non-debugging symbols:
0x0000555555555180  nvmlDeviceGetMemoryInfo@plt
0x00007ffff6c18580  nvmlDeviceGetMemoryInfo_v2@plt
0x00007ffff6c494a0  nvmlDeviceGetMemoryInfo
0x00007ffff6c496d0  nvmlDeviceGetMemoryInfo_v2
# 运行到断点
c
# 查看断点栈信息
bt
# 查看所有断点
info b
# 输出如下,符合预期
0  nvmlDeviceGetMemoryInfo (device=0x7ffff6ffaf38, memory=0x7fffffffdfc0) at /libvgpu/src/nvml/hook.c:368
1  0x00005555555553d8 in get_current_memory_usage (usage=usage@entry=0x555555558030 <usage>) at /libvgpu/test/test_utils.h:70
2  0x0000555555555831 in main () at /libvgpu/test/test_alloc.c:76
# 如果错过断点,可以重新来
r
# 列出所有可以debug的方法名
info functions
# 输出如下
All defined functions:

Non-debugging symbols:
0x0000000000402f10  getenv@plt
0x0000000000402f20  free@plt
0x0000000000402f30  putchar@plt
0x0000000000402f40  pthread_create@plt
0x0000000000402f50  endmntent@plt
0x0000000000402f60  strcasecmp@plt
# 设置变量
set {char[5]} 0x7fffffffdfc0 = "nvmlInit"
# 查看变量
print 0x7fffffffdfc0
# 输出如下
$1 = "nvmlInit"
# 设置环境变量
set environment LD_PRELOAD=/libvgpu/build/libvgpu.so
# 查看环境变量
show environment LD_PRELOAD
5. 一个debug例子
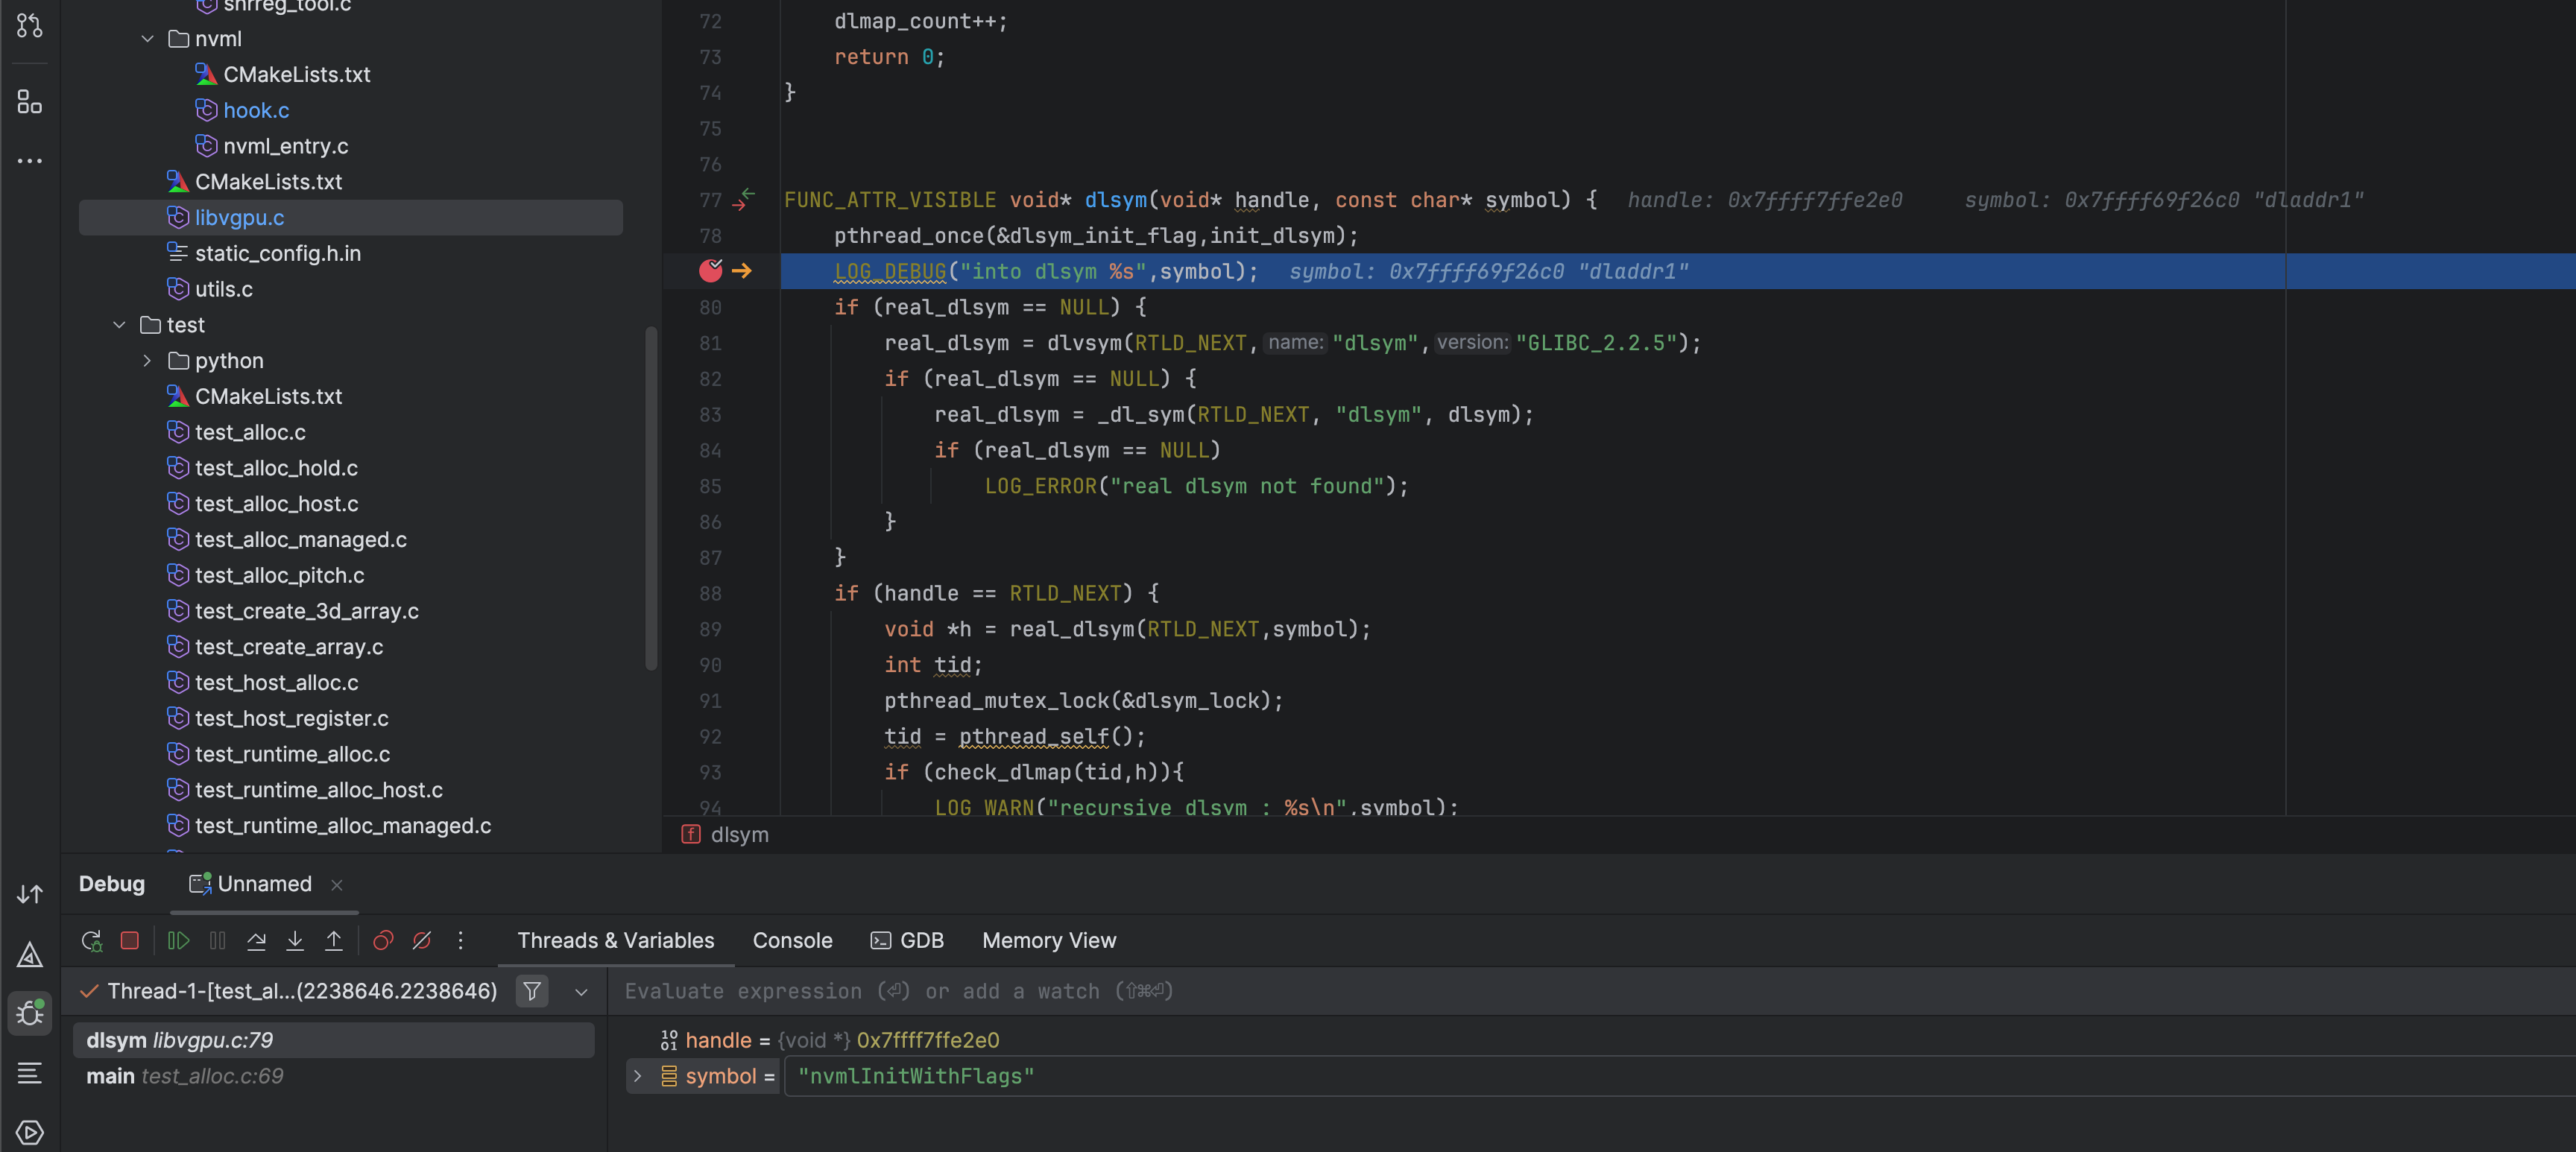
HAMI-core 项目中 test/test_alloc.c 文件中 main 函数中调用了 nvmlDeviceGetMemoryInfo 方法, 我们debug下这个方法
通过读代码可知,调用流程为 首先调用dlsym, dlsym会初始化方法,这里nvml使用 nvmlInitWithFlags 注册nvml重写方法,调用时会找到注册的方法地址,然后通过方法地址调用重写的方法,所以debug时首先需要找到dlsym的调用位置,然后找到重写的方法地址,最后找到重写的方法调用位置
export LD_PRELOAD=/libvgpu/build/libvgpu.so
gdb ./test/test_alloc
# 打断点
b main
# 运行
r
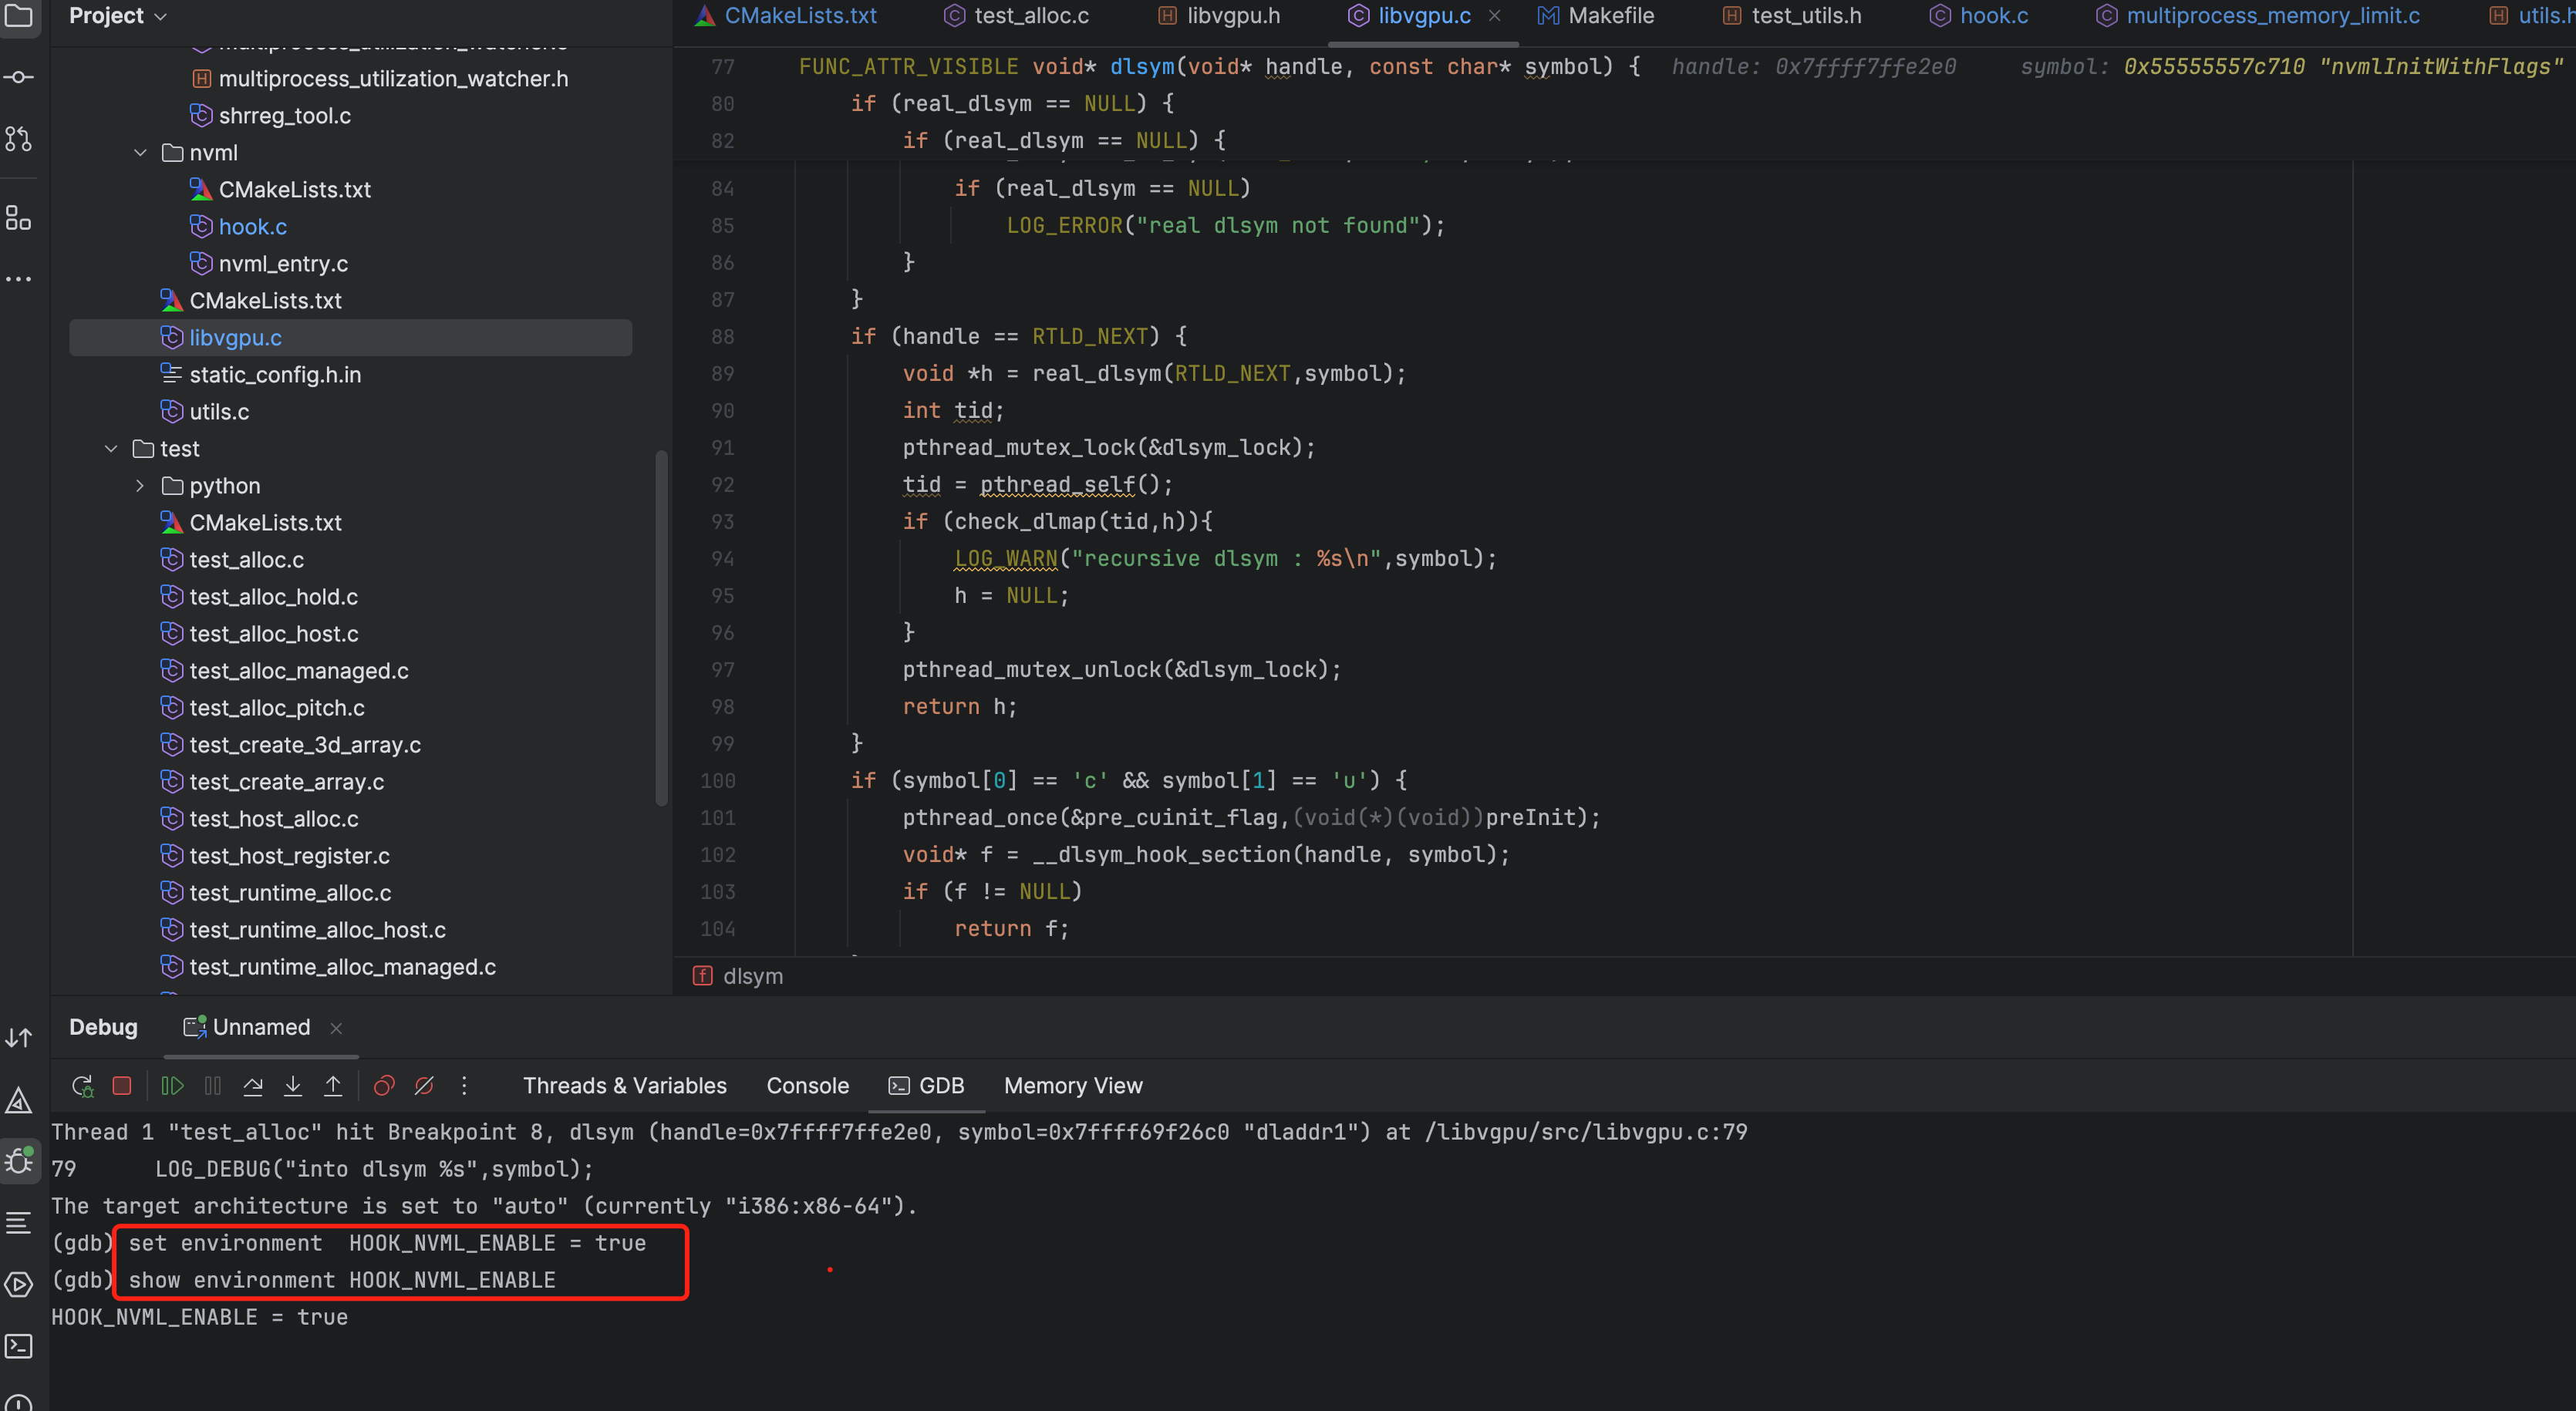
# 打dlsym的断点,这里会有多个实现所以可以指定文件打断点
# 运行到这里的时候需要手动更改下symbol的值和环境变量HOOK_NVML_ENABLE的值,确保重写的方法nvmlDeviceGetMemoryInfo内存地址被hook到
b /libvgpu/src/libvgpu.c:77
# 找到nvmlDeviceGetMemoryInfo方法
info functions nvmlDeviceGetMemoryInfo
# 打断点
b /libvgpu/src/nvml/hook.c:368
# 在进入下一层
b get_current_device_memory_usage
# 开始运行
c
# 输出如下
(gdb) c
Continuing.
[New Thread 0x7ffff4e5b640 (LWP 2200336)]
Thread 1 "test_alloc" hit Breakpoint 2, dlsym (handle=0x7ffff7ffe2e0, symbol=0x7ffff69f26c0 "dladdr1") at /libvgpu/src/libvgpu.c:78
78 pthread_once(&dlsym_init_flag,init_dlsym);
# 这里需要修改 symbol为 nvmlInitWithFlags
set {char[18]} 0x7ffff69f26c0 = "nvmlInitWithFlags"
# 验证
p symbol
$2 = 0x7ffff69f26c0 "nvmlDeviceGetMemoryInfo"
# 设置环境变量 HOOK_NVML_ENABLE 为 true
set environment HOOK_NVML_ENABLE = true
# 验证
show environment HOOK_NVML_ENABLE
HOOK_NVML_ENABLE = true
# 下一个断点
(gdb) c
Continuing.
[New Thread 0x7fffe8fde640 (LWP 2219816)]
[New Thread 0x7fffe2fde640 (LWP 2219817)]
Thread 1 "test_alloc" hit Breakpoint 5, nvmlDeviceGetMemoryInfo (device=0x7ffff6ffaf38, memory=0x7fffffffdfc0) at /libvgpu/src/nvml/hook.c:367
367 return _nvmlDeviceGetMemoryInfo(device,memory,1);
(gdb) s
_nvmlDeviceGetMemoryInfo (device=0x7ffff6ffaf38, memory=0x7fffffffdfc0, version=1) at /libvgpu/src/nvml/hook.c:317
317 FUNC_ATTR_VISIBLE nvmlReturn_t _nvmlDeviceGetMemoryInfo(nvmlDevice_t device,nvmlMemory_t* memory,int version) {
(gdb) l
312 }
313
314 void nvml_postInit() {
315 }
316
317 FUNC_ATTR_VISIBLE nvmlReturn_t _nvmlDeviceGetMemoryInfo(nvmlDevice_t device,nvmlMemory_t* memory,int version) {
318 unsigned int dev_id;
319 LOG_DEBUG("into nvmlDeviceGetMemoryInfo");
320
321 switch (version){
(gdb) c
Continuing.
Thread 1 "test_alloc" hit Breakpoint 4, get_current_device_memory_usage (dev=0) at /libvgpu/src/multiprocess/multiprocess_memory_limit.c:877
这样我们就可以debug整个链路
6. 例子2: debug nvidia-smi
export LD_PRELOAD=/libvgpu/build/libvgpu.so
whereis nvidia-smi
gdb /usr/bin/nvidia-smi
# 找到可以打断点的方法
info functions
# 例如dlysm是一定会被调用的
b dlsym
# 开始运行
r
# run之后动态库被加载,可以debug动态库中的方法
# 查看哪些方法可以debug
info functions
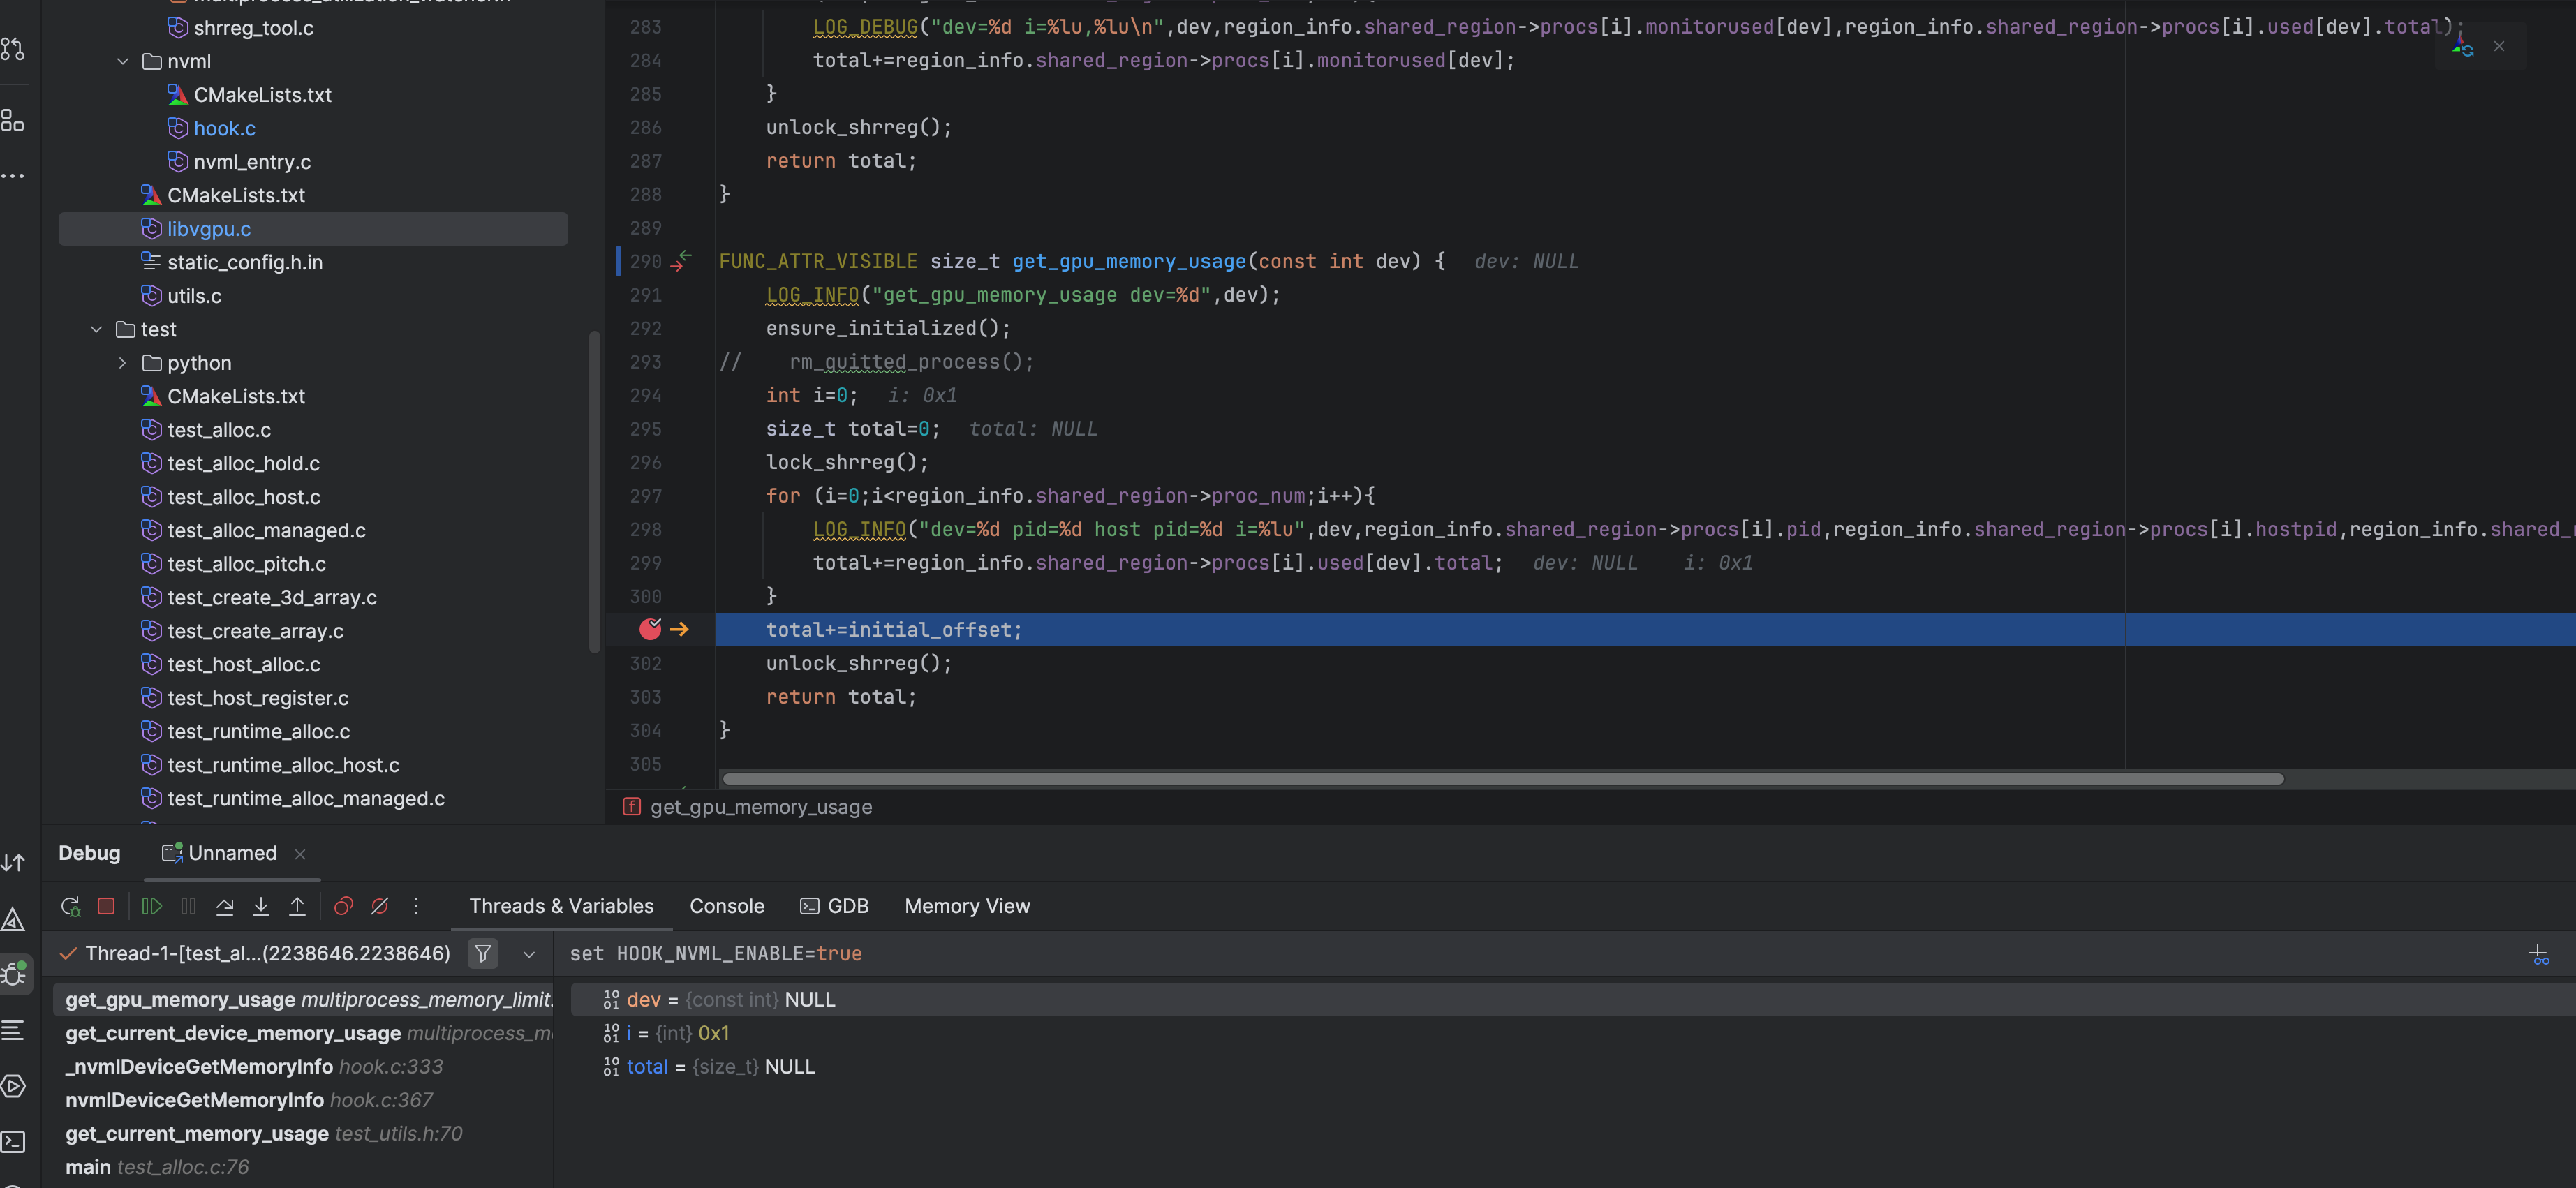
# 例如nvidia-smi一定会调用到get_gpu_memory_usage
b get_gpu_memory_usage
# 跳到断点
c
# 这里会反复循环
Breakpoint 1, ___dlsym (handle=0x718f30, name=0x7ffff7fa8520 "nvmlVgpuInstanceSetEncoderCapacity") at ./dlfcn/dlsym.c:64
64 in ./dlfcn/dlsym.c
# 是因为上面的dlsym有多个实现,这里我们不需要知道系统的dlsym是怎么实现的所以可以把这个断点删掉
info b
# 输出如下
Num Type Disp Enb Address What
2 breakpoint keep y 0x00007ffff4e695b4 <nvmlDeviceGetNumaNodeId+4>
4 breakpoint keep y <MULTIPLE>
4.1 y 0x00007ffff4e55ec4 <nvmlVgpuInstanceGetVmID+4>
4.2 y 0x00007ffff7f81027 in nvmlVgpuInstanceGetVmID at /libvgpu/src/nvml/nvml_entry.c:1132
5 breakpoint keep y 0x00007ffff7f9cf5a in get_gpu_memory_usage at /libvgpu/src/multiprocess/multiprocess_memory_limit.c:291
6 breakpoint keep y <MULTIPLE>
breakpoint already hit 4 times
6.1 y 0x00007ffff7cd9740 in ___dlsym at ./dlfcn/dlsym.c:64
6.2 y 0x00007ffff7f72acf in dlsym at /libvgpu/src/libvgpu.c:78
# 禁用6.1这个断点
disable 6.1
# 继续就可以debug到了
c
Breakpoint 6, dlsym (handle=0x718f30, symbol=0x4d1e79 "nvmlDeviceGetMemoryInfo_v2") at /libvgpu/src/libvgpu.c:78
78 pthread_once(&dlsym_init_flag,init_dlsym);
(gdb)
Continuing.
Breakpoint 5, get_gpu_memory_usage (dev=0) at /libvgpu/src/multiprocess/multiprocess_memory_limit.c:291
291 LOG_INFO("get_gpu_memory_usage dev=%d",dev);
(gdb)
7. 使用clion远程debug
7.1. 代码同步
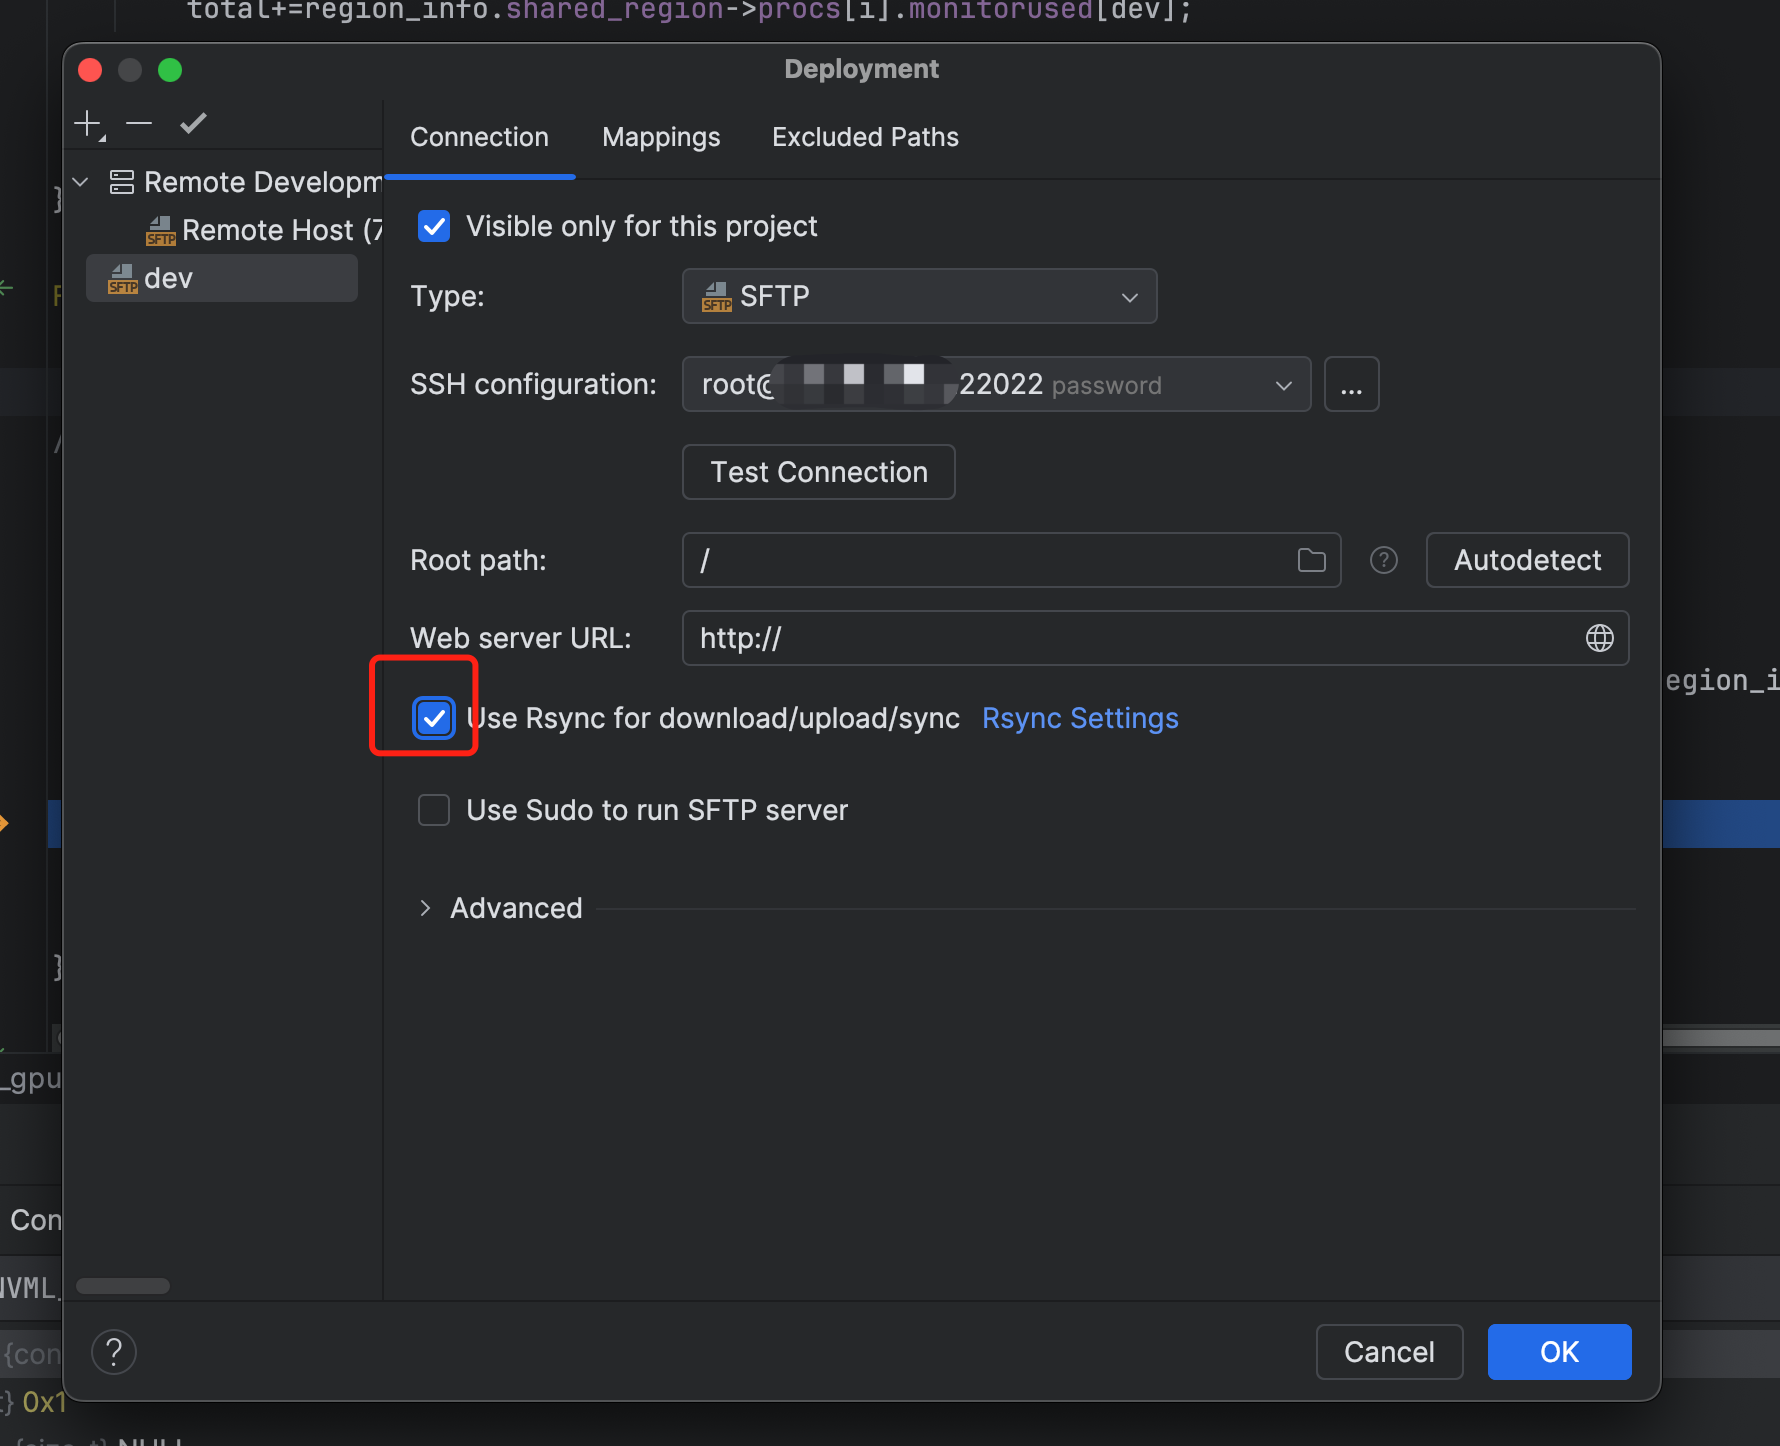
Tools -> Deployment -> Configuration
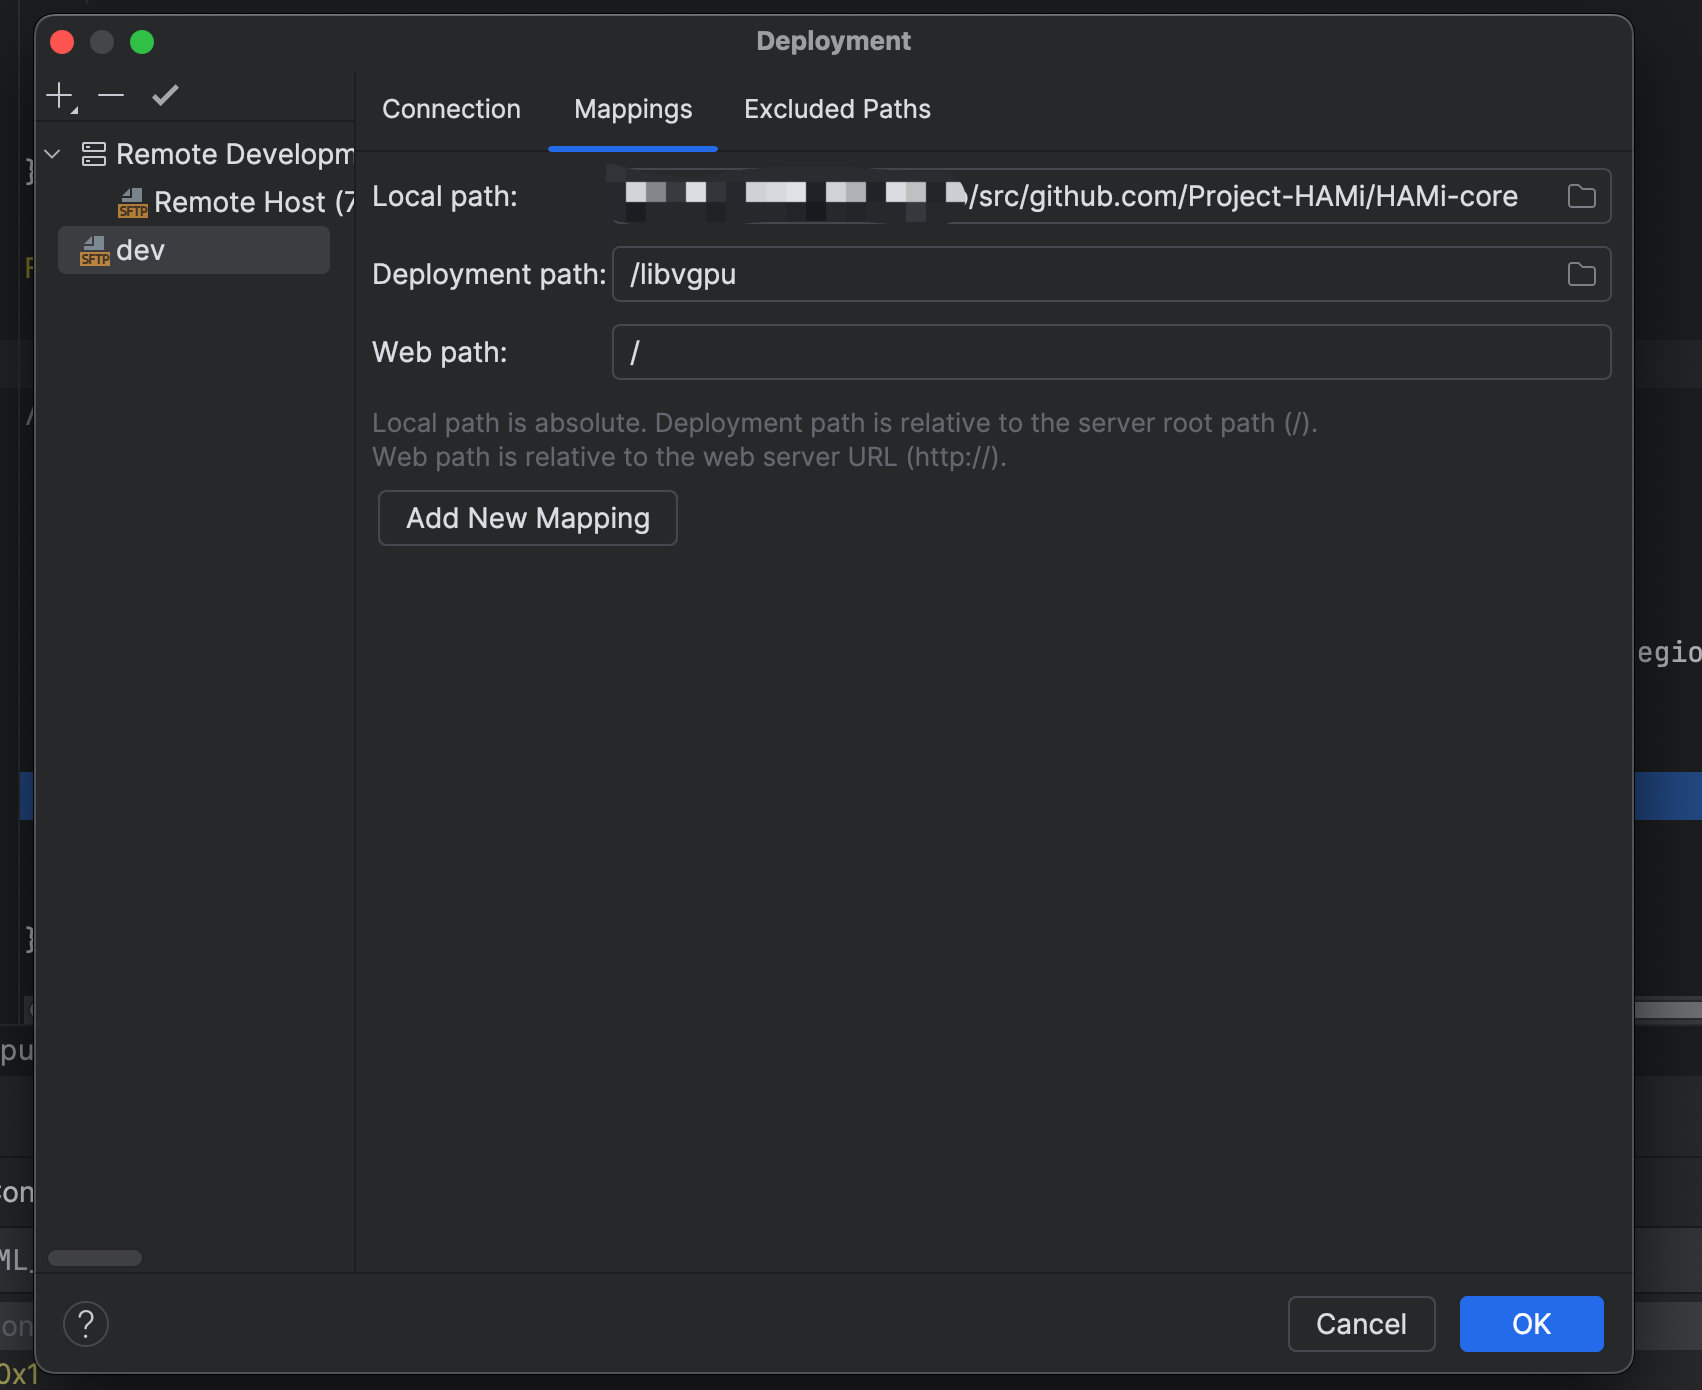
添加一个SFTP, 填写玩connection之后填写 目录映射
Local path: /go/src/github.com/Project-HAMi/HAMi-core
Remote path: /libvgpu
勾选同步 Use Rsync for download/upload/sync
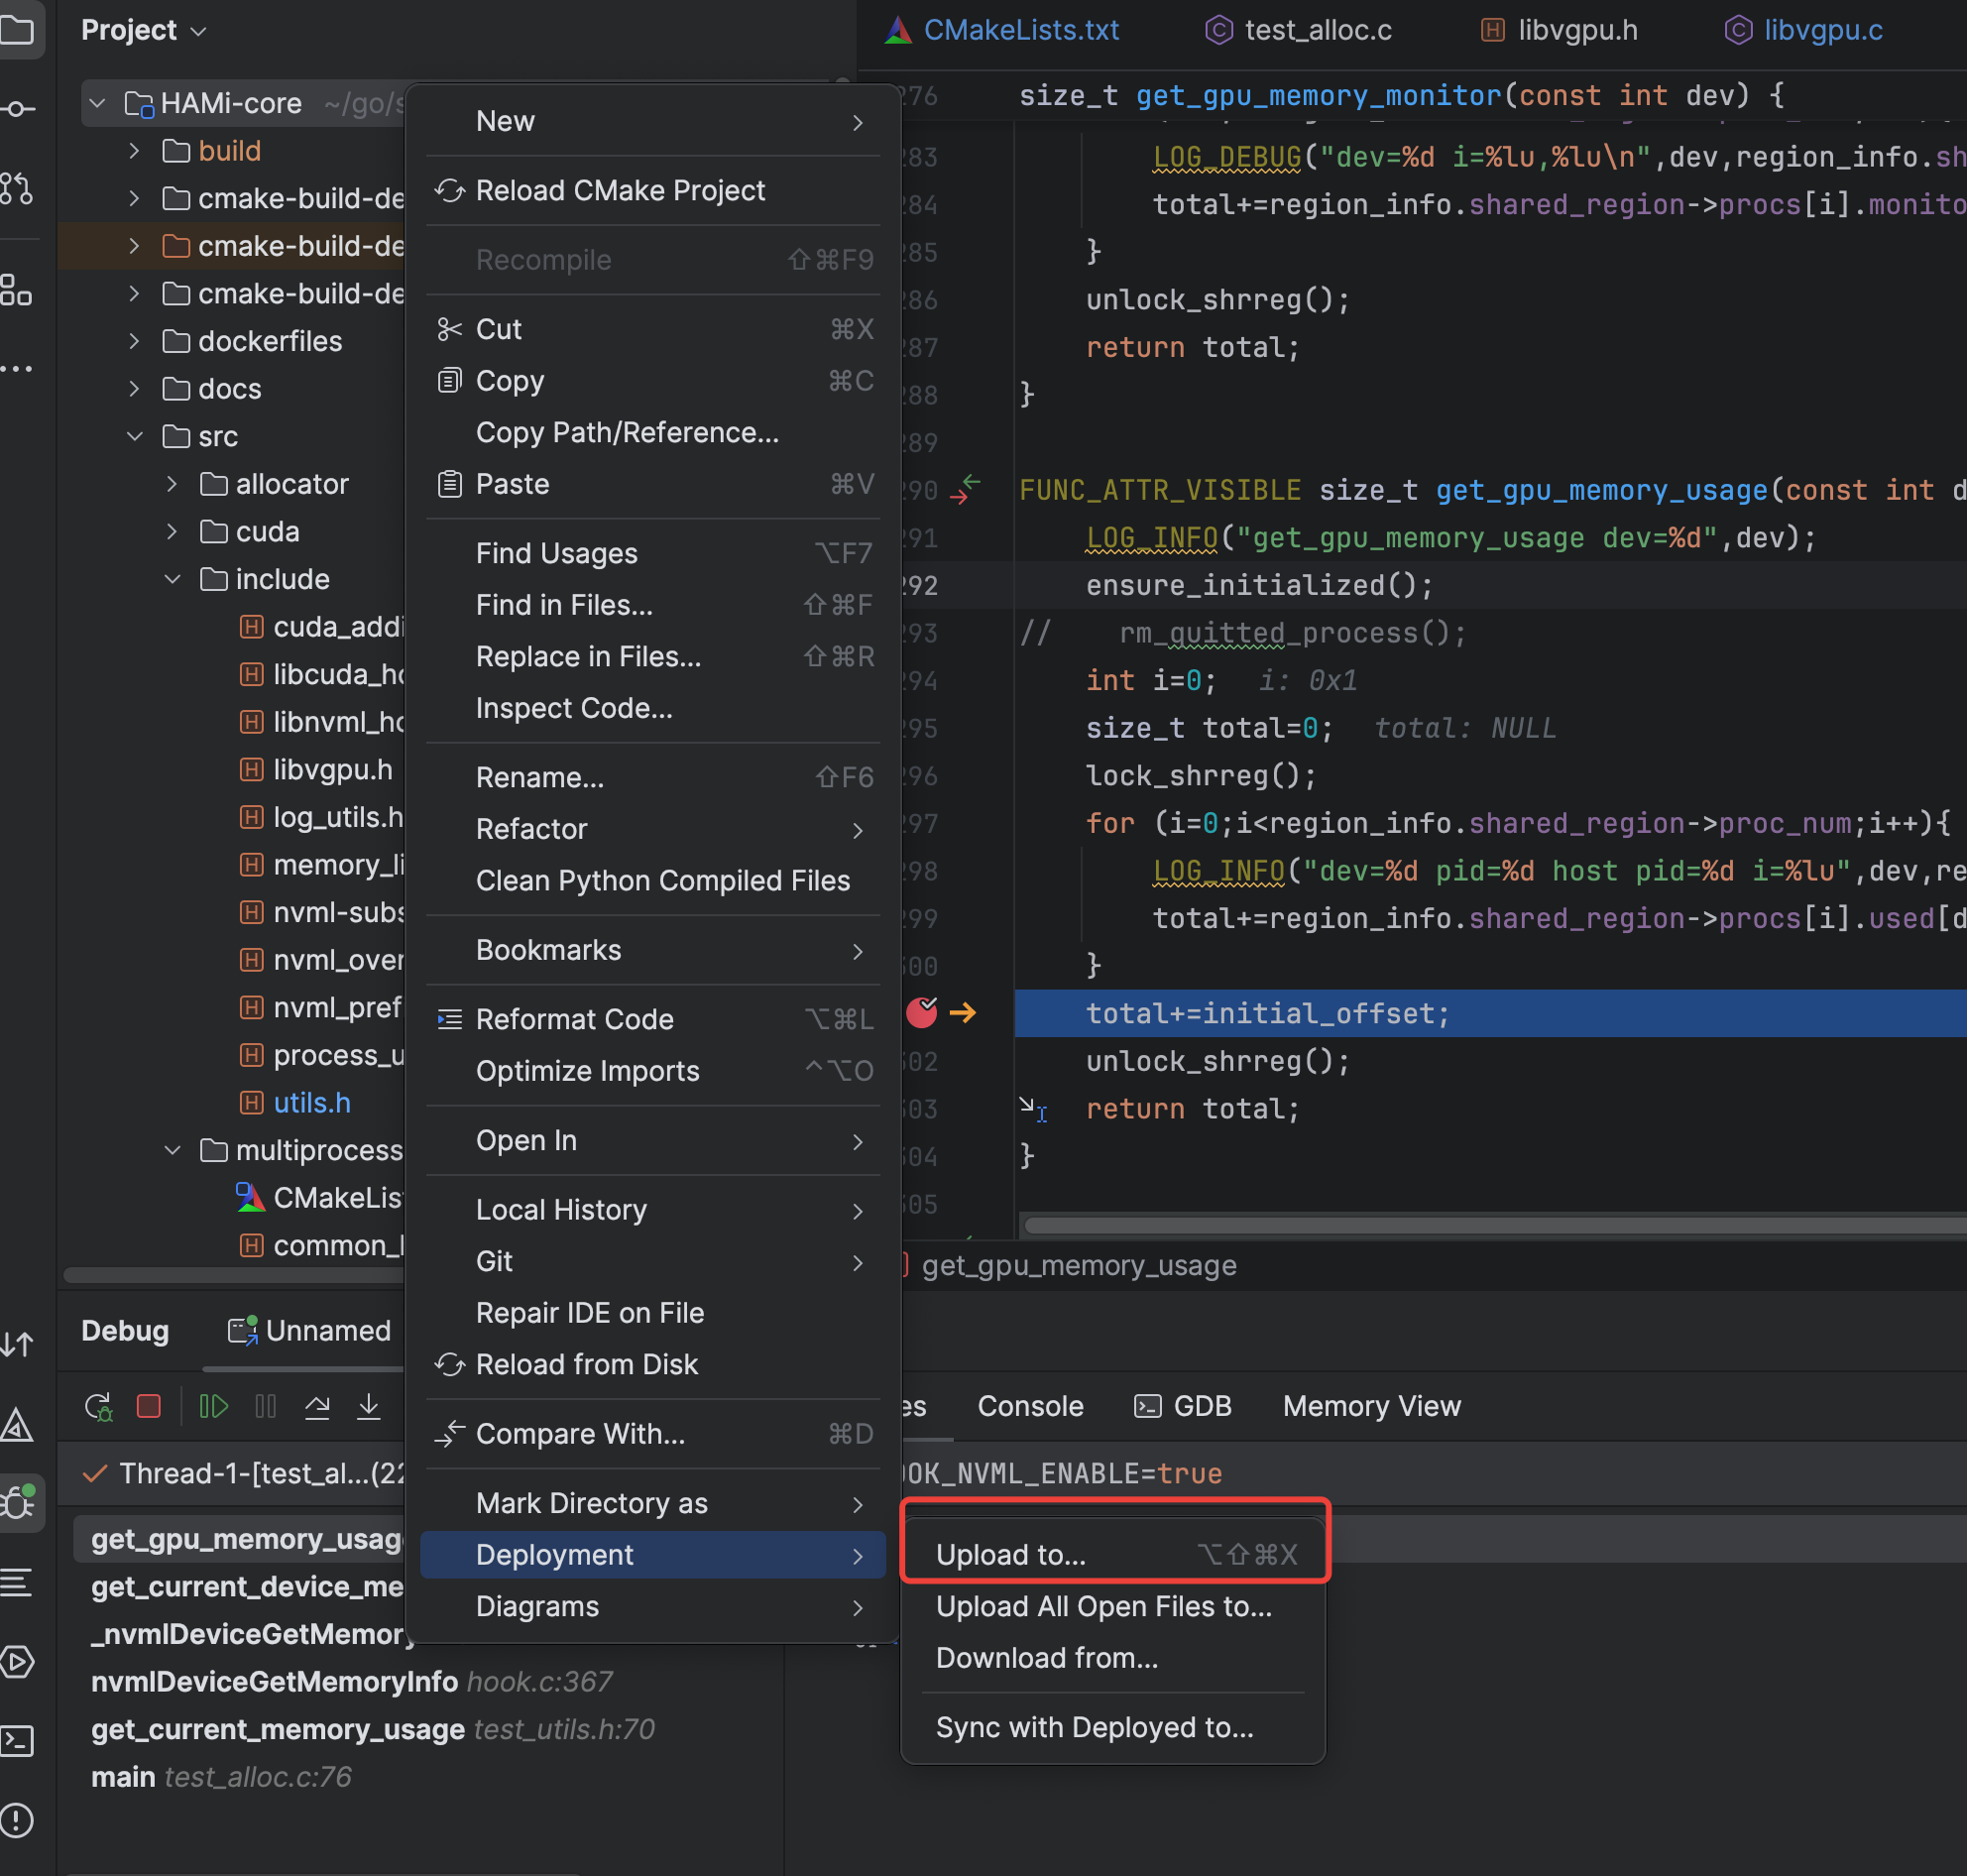
同步代码
有两种方式,一种是gdb远程调试,另一种是clion远程调试
7.2. gdb远程调试
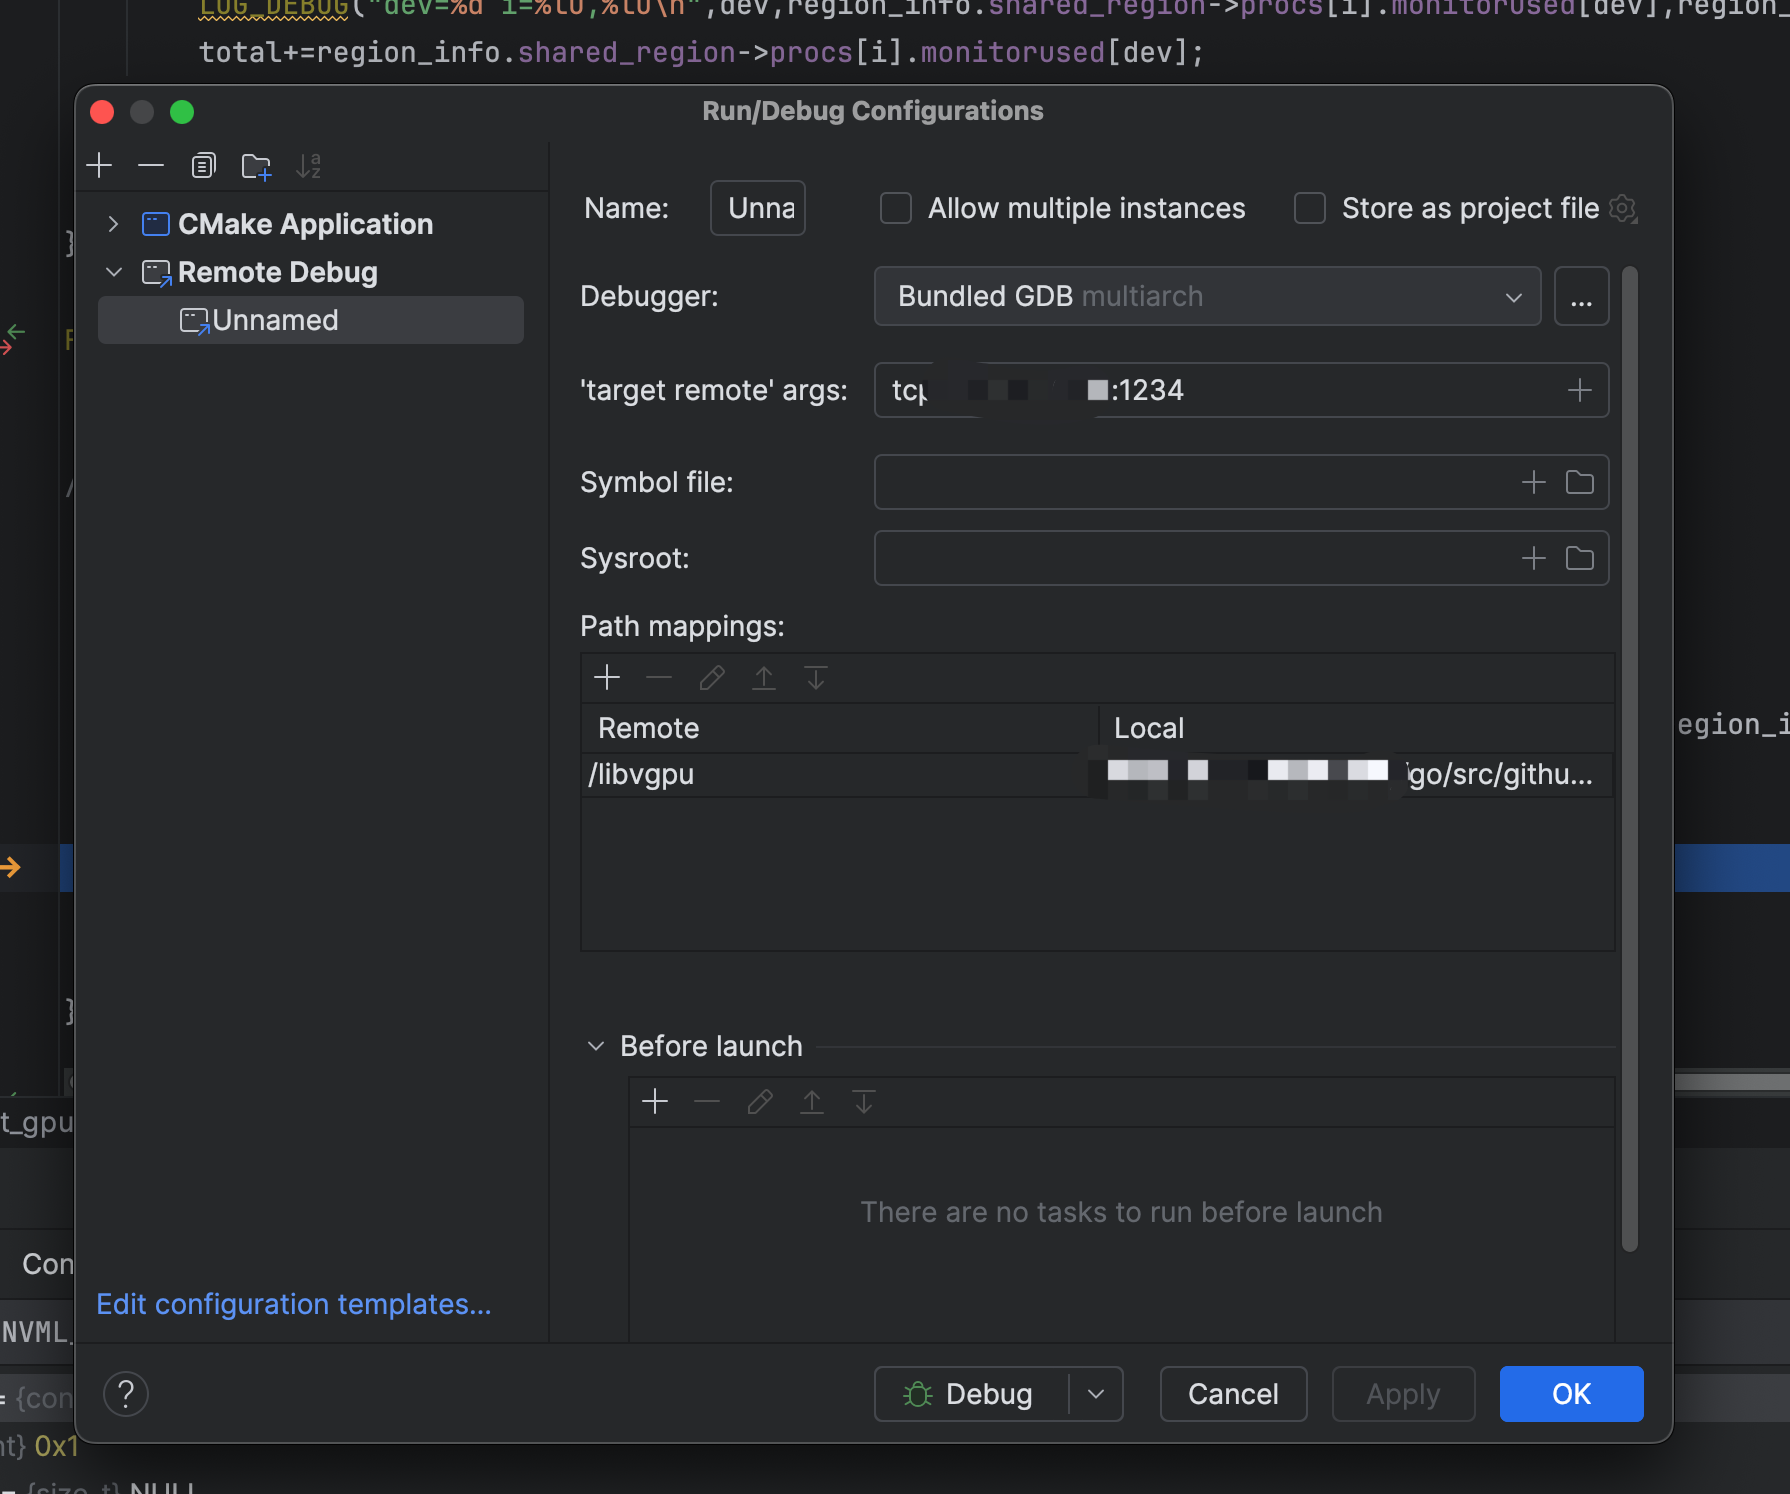
Run/Debug -> Debugger -> GDB Remote Debugging -> 填写Remote Host和Remote Port
'target remote' args: tcp:10.10.200.8:1234
Path Mapping: /libvgpu -> /go/src/github.com/Project-HAMi/HAMi-core
在服务器上启动gdbserver
gdbserver :1234 ./test/test_alloc
本地打断点,点击debug按钮
首先断点dlsym的调用位置,修改symbol为nvmlInitWithFlags
设置环境变量HOOK_NVML_ENABLE为true
继续断点,一直到最终的 get_gpu_memory_usage
7.3. clion远程调试
Clion -> Settings -> Build, Execution, Deployment -> Toolchains 新增一个
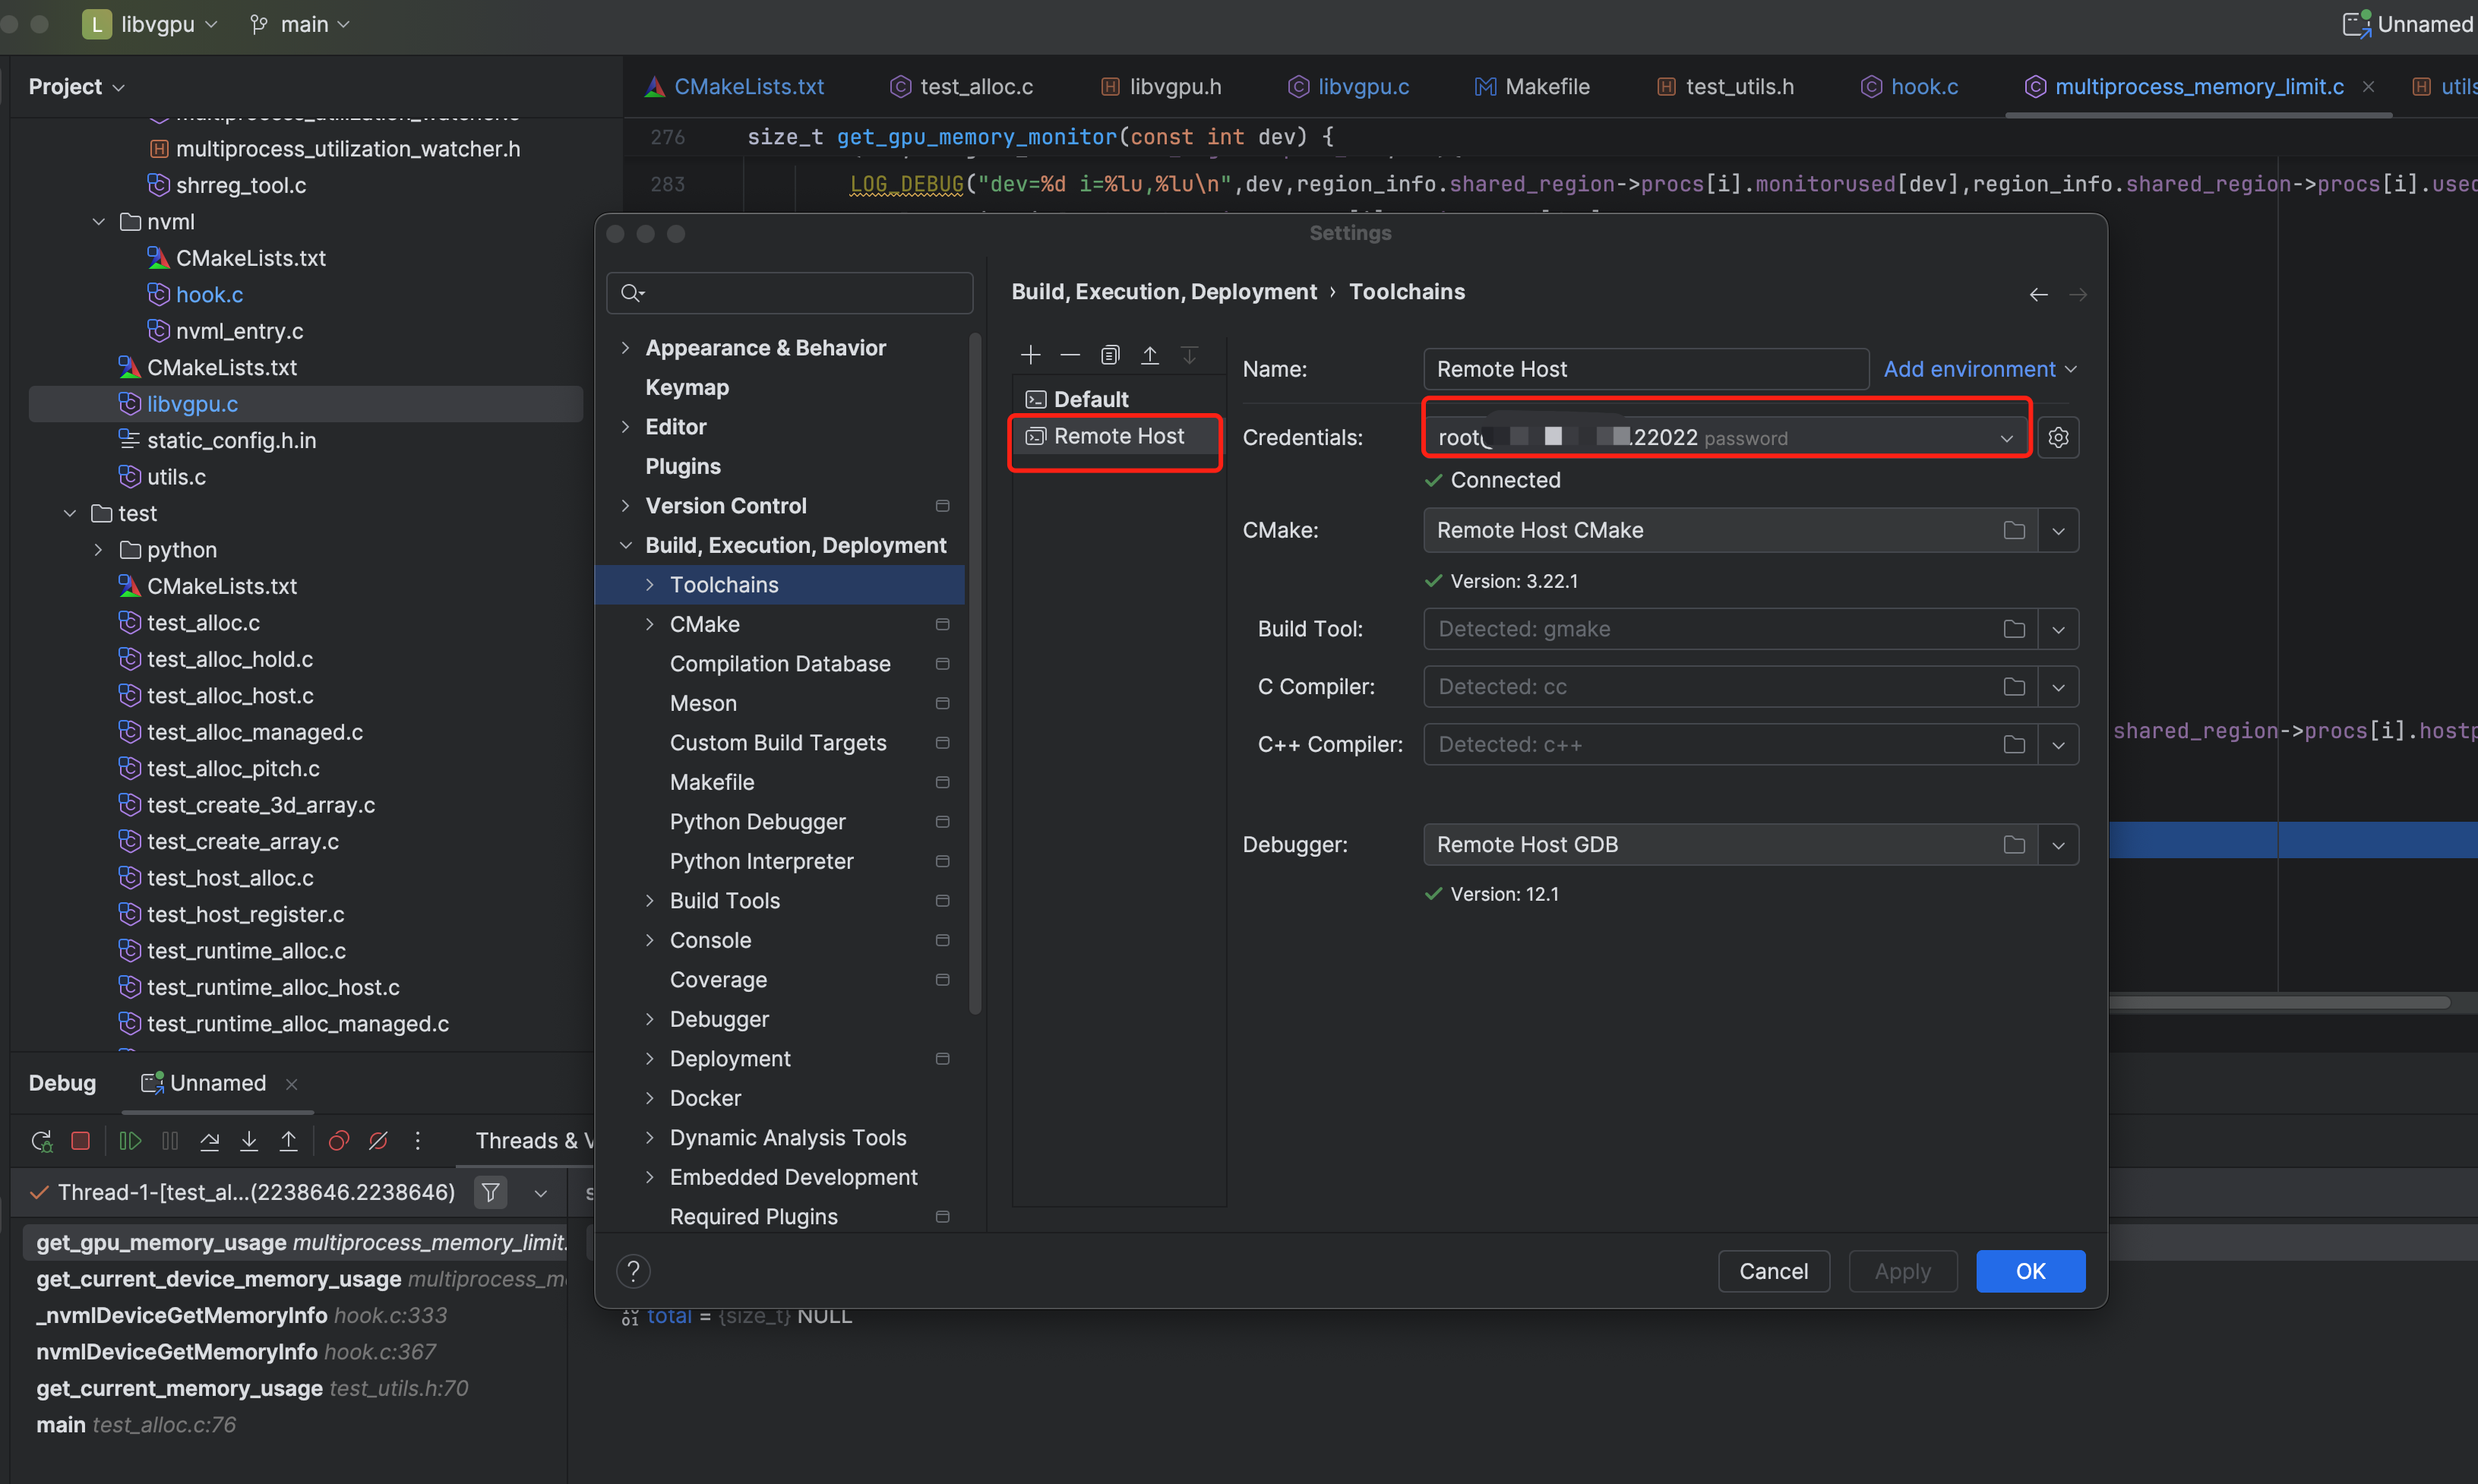
Clion -> Settings -> Build, Execution, Deployment -> CMake 新增一个
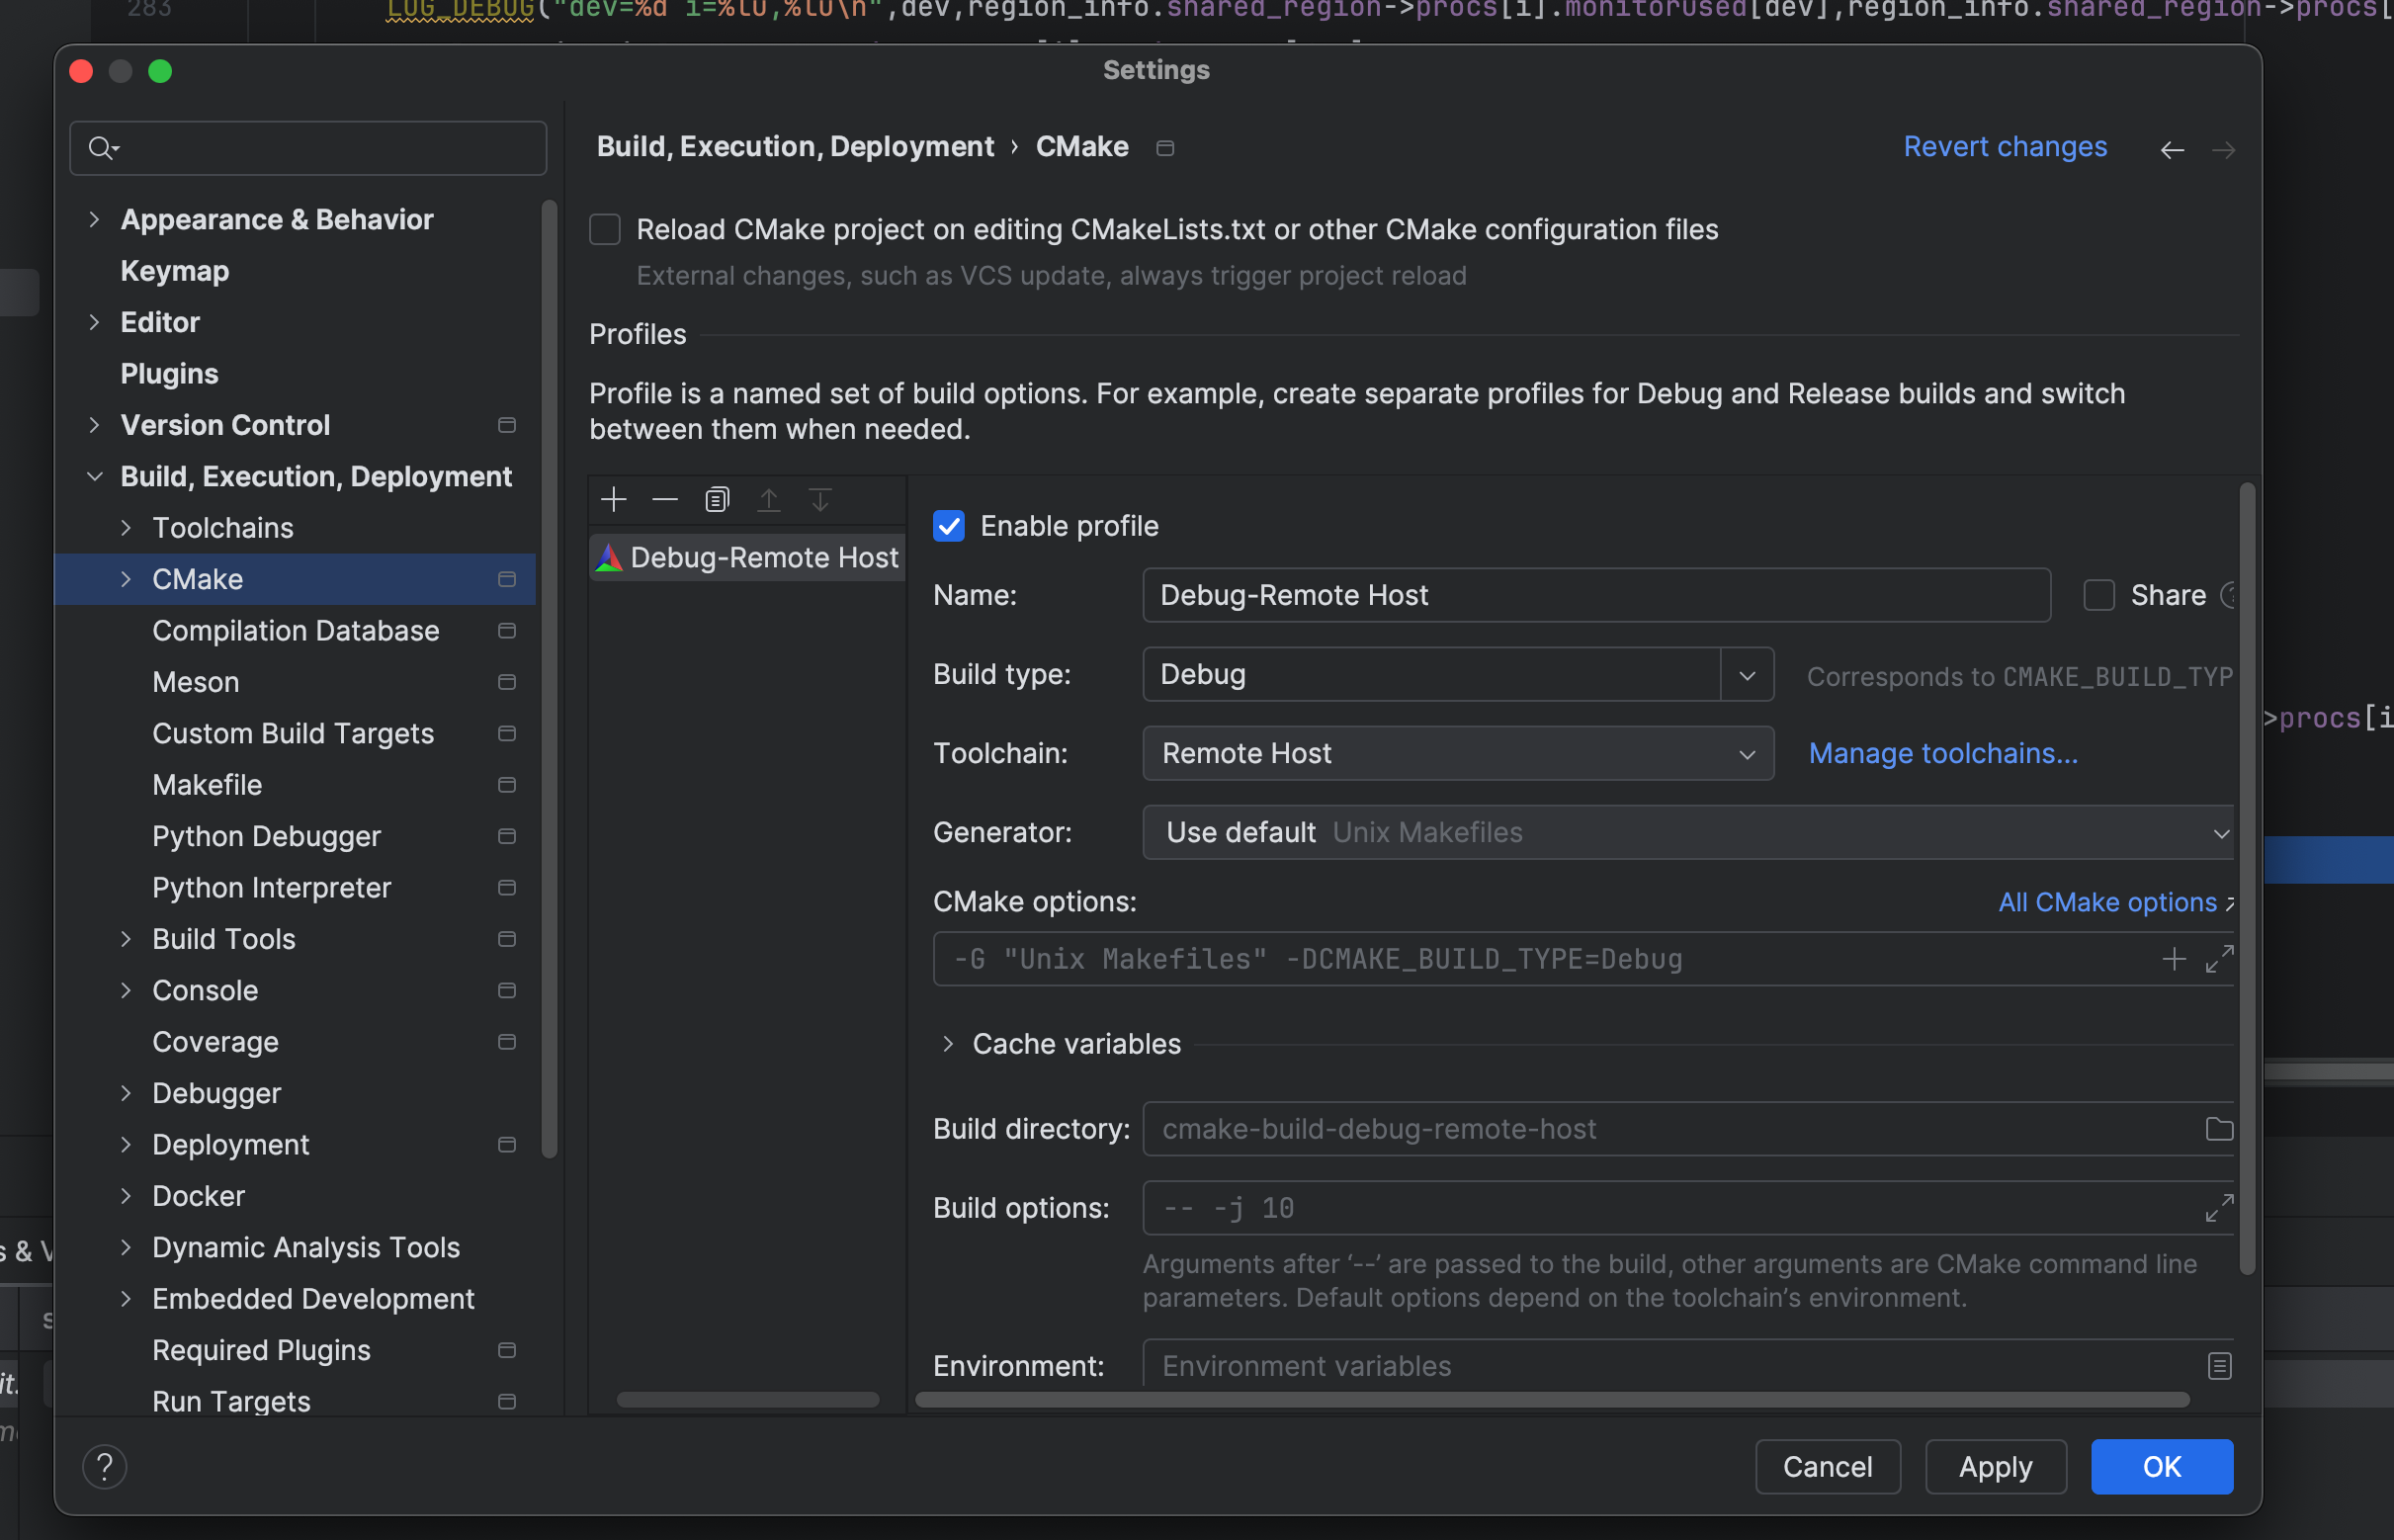
build type选择 debug,toolchain选择刚刚创建的, 其他默认即可
配置完毕之后即可在 Run/Debug Configuration 看到许多可以调试的应用
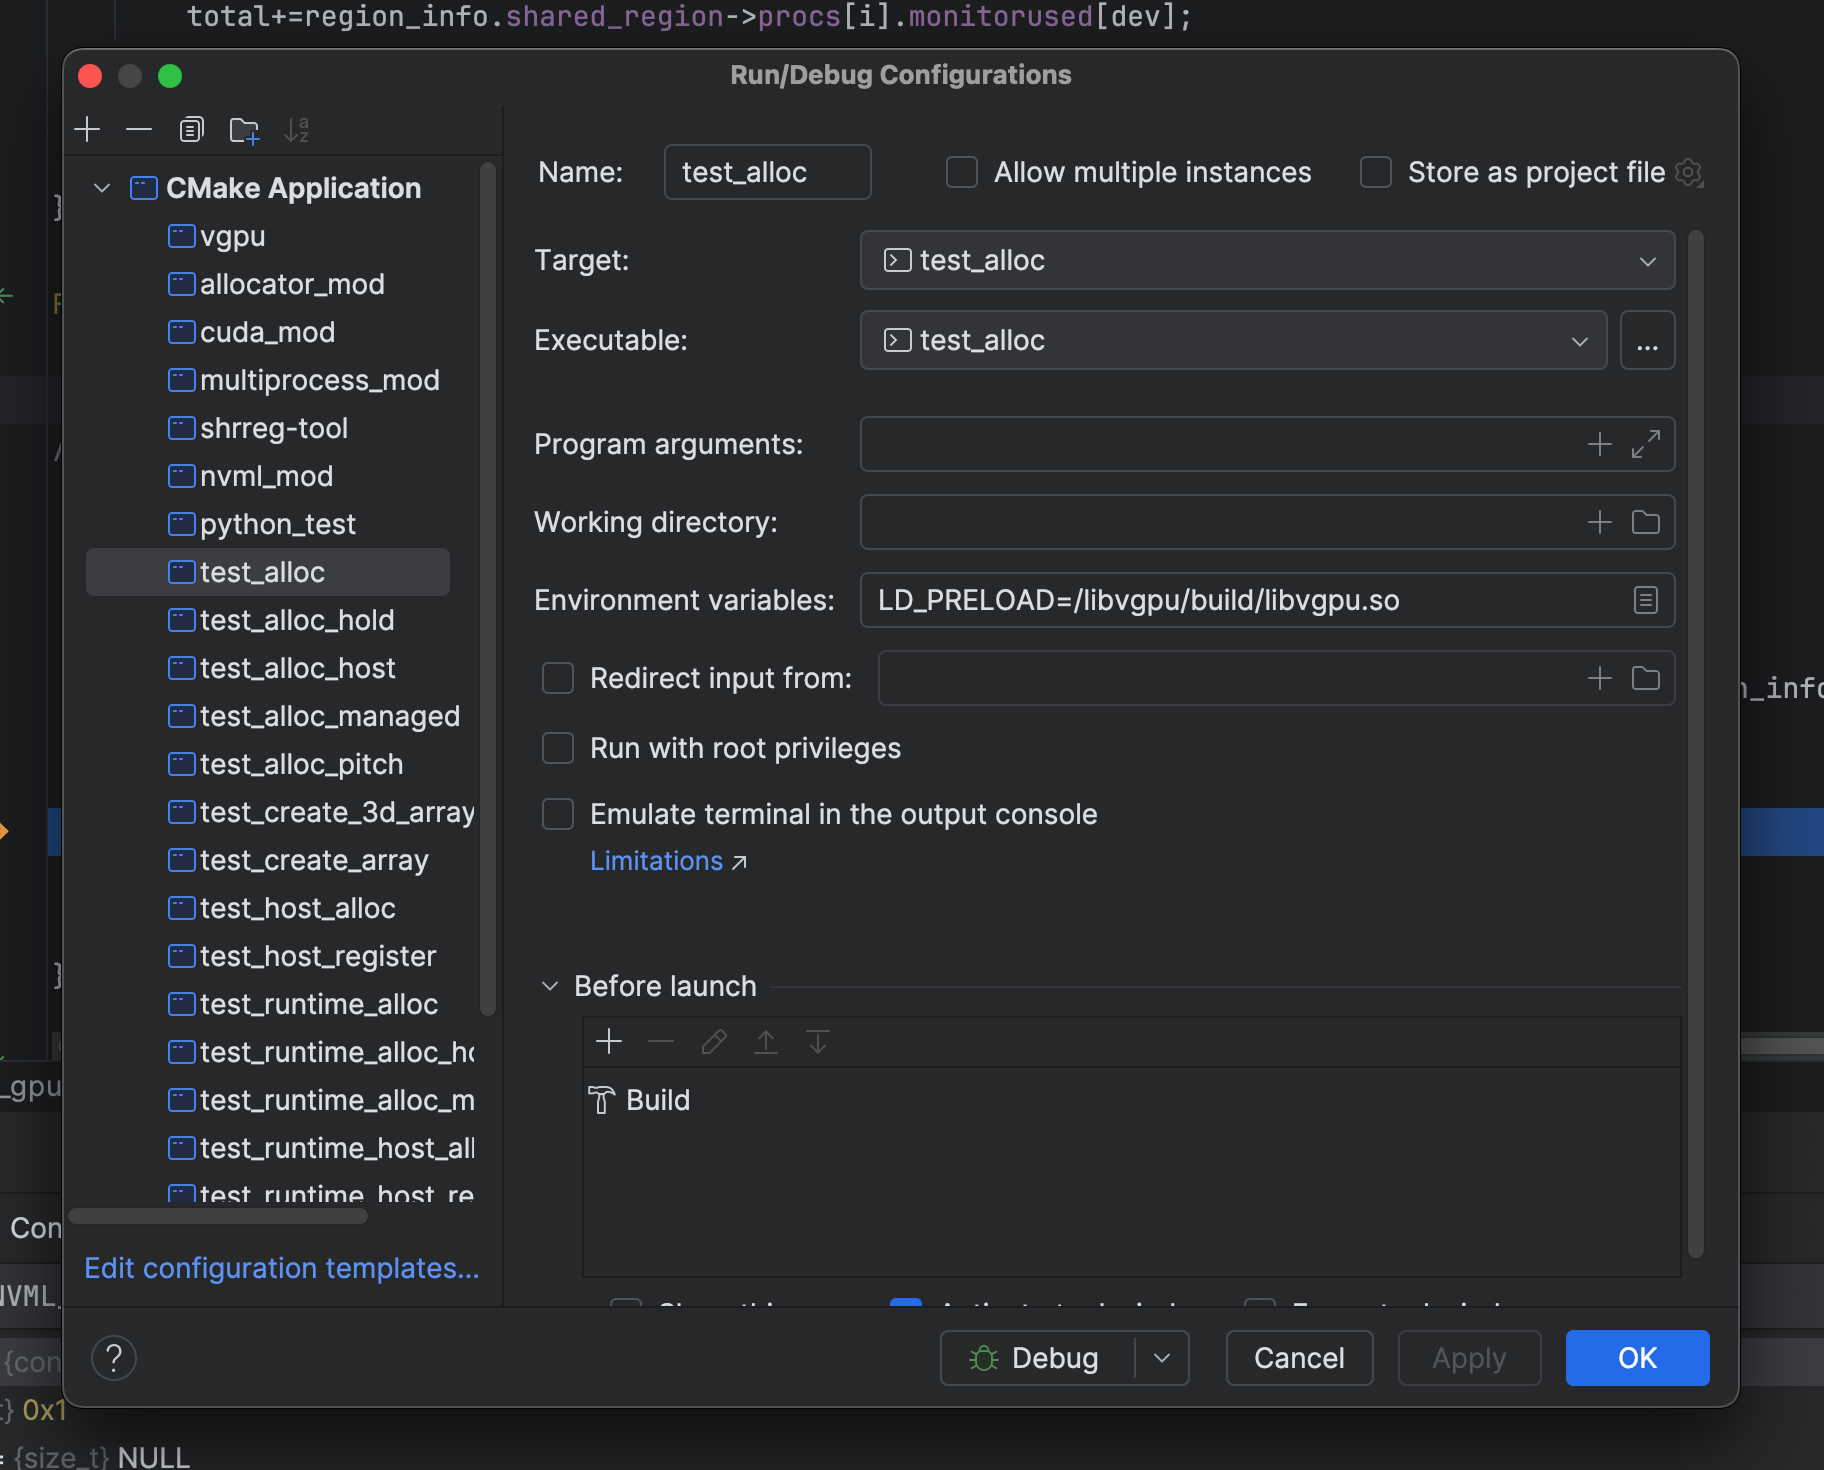
选择一个调试即可, 例如调试test_alloc则需配置 executable 和 Environment variable这样可直接调试,无需手动在服务器上启动gdbserver